


Population synthesis and photoionization models of dusty, infrared-bright
galaxies such as Arp 299, M 82, and NGC 4038 / 39, indicate that short-lived
bursts of star formation with ages of 3-7 × 10⁶ years,
can best explain the LWS spectra of these galaxies
(Satyapal et
al. 2000,
Colbert et
al. 1999,
and Fischer et
al. 1996).
Thornley et
al. (2000)
find similar results from an analysis of their [NeIII]15.6
µm, [NeII] 12.8 µm survey of 27 starburst
galaxies. Satyapal et al. show that the models derived from LWS
measurements including all of the individual components of Arp 299 are
indeed consistent with the ensemble of model fits to high spatial
resolution Brackett
 images of
individual components of this galaxy.
Unger et al. (2000)
find that even in Cen A,
the extended far-infrared emission is powered primarily by star
formation rather than by the central obscured AGN.
images of
individual components of this galaxy.
Unger et al. (2000)
find that even in Cen A,
the extended far-infrared emission is powered primarily by star
formation rather than by the central obscured AGN.
Fischer et al. (1000) have presented a sequence of full, high signal-to-noise LWS spectra of six infrared bright galaxies (see Figure 6) in order of the relative strength of the [OIII] 52, 88µm fine-structure lines. The spectral sequence extends from the strong emission line galaxies Arp 299 (Satyapal et al. 2000) and M 82 (Colbert et al. 1999) to the ULIG Arp 220, whose spectrum is dominated by absorption lines of OH, H2O, CH, and [OI], with only very weak [CII] 158µm and OH 163µm line emission. Intermediate in the sequence are Cen A (Unger et al. 2000), NGC 253 (Bradford et al. 1999) and NGC 4945 (Lord et al. 2000), showing weak [OIII] and [NIII] lines while their PDR emission lines remain moderately strong. In this sequence, the strength and richness of the molecular absorption spectra are anti-correlated with the equivalent widths of the fine-structure emission lines. For example, M 82 shows faint OH absorption from the ground level at 119µm, while NGC 253 shows absorption from the ground-state in three cross-ladder transitions and an emission line cascade in the 79µm and 163µm lines. In Arp 220, absorption from rotational levels as high as 416 K and 305 K above the ground state is present for OH and H2O respectively, and the [OI]63µm line is seen in absorption.
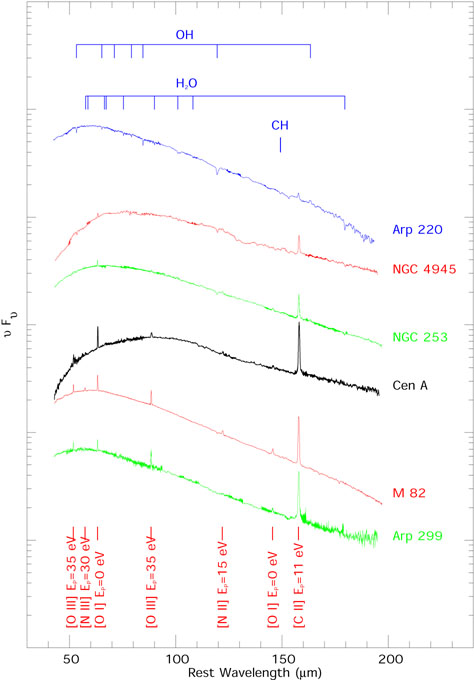 |
Figure 6. The full ISO Long Wavelength Spectrometer spectra of six IR-bright galaxies. The spectra have been shifted and ordered vertically according to the equivalent width of the [O III]88 µm line. The excitation potential, the energy required to create the species, is given in eV at the bottom of the figure. From Fischer et al. (1999). |
Using the temperature-insensitive [OIII] 52 µm/[OIII] 88 µm line ratio as a probe of density, Fischer et al. find no clear dependence of the [OIII]88 / FFIR ratio on electron density and all of the measured [OIII] line ratios were found to fall within the range 0.6 - 1.2, consistent with electron densities between 100 - 500 cm-3. From this they infer that neither density nor far-infrared differential extinction (between 52 - 88 µm) to the ionized gas appears to be the single dominant parameter in the observed sequence. Rather, since both of the line ratios [NIII]57 / [NII]122 and [OIII]52 / [NIII]57 increase as a function of the [OIII]88 / FFIR ratio, they infer that [OIII]88 / FFIR correlates with excitation. They suggest that progression to soft radiation fields or dusty H II regions may explain these effects and that the absorbing molecules may be located in dense photodissociation regions, where they could be excited radiatively by the far-infrared emission from warm dust. If extinction plays a role in this sequence it appears from this analysis that the affected regions are very heavily obscured even in the far-infrared, while the detected line emission is relatively unobscured. In this case, the progression to low excitation could be a result of total obscuration of the youngest starburst population and/or the central AGN.