


Before studying the statistical distribution of the log. absolute major diameters of the members of the physical groups, we shall reduce the apparent diameters, as measured on the blue Sky Atlas prints, to the writer's photometric diameter system. This system, which is defined by the diameters listed for 300 galaxies in Holmberg (1958), is based on a homogeneous plate material from the Mount Wilson 60-inch and 100-inch telescopes, and refers to a pg isophote of about 26m.m5 per square second. A comparison of the Sky Atlas diameters with the photometric diameters indicates that the latter are, on an average, 1.46 times larger. The correction factor naturally depends to a certain extent on the type and the surface magnitude of the galaxy; for the smallest objects the factor can be determined only by extrapolation. However, if all log. diameters, as derived from the Sky Atlas, are increased by the same amount or 0.16, the internal consistency of the diameter system will remain unchanged. For most of the larger galaxies to be included in the analysis of the diameter distribution, the diameters can be taken directly from the writer's catalogue.
The statistical distribution of the log. major diameters, log A, of
all the satellites
in the 160 groups referring to spiral systems of classes A,
B and C is given in Table 4.
By the above correction, the limiting absolute diameter (in the extended
survey
with distance moduli  30.0)
has been increased from 0.61 to 0.89 kpc, corresponding
to a log. diameter (pc) of 2.95. The absolute magnitudes contained in
the second column of the table will be explained in the next
section. The third column gives for
successive classes of log A the total number of physical and optical
companions in
the 160 (57) survey areas (class A: pos. angles > 30°;
cf. sect. 7). The number (slightly
smoothed out) of optical companions, as derived from all the comparison
areas, is
listed in the fourth column. It may be recollected that this number
should be multiplied by the factor 0.65/2 (class A), or 0.95/2
(class B - C); the mean factor amounts
to 0.413 in the first diameter class, and to 0.425 in the remaining
classes. The resulting number of physical satellites, in all 274,
appears in the last column. The mean
error listed reflects the accidental fluctuations in the number of
optical companions; it has been derived from the square root of this number.
30.0)
has been increased from 0.61 to 0.89 kpc, corresponding
to a log. diameter (pc) of 2.95. The absolute magnitudes contained in
the second column of the table will be explained in the next
section. The third column gives for
successive classes of log A the total number of physical and optical
companions in
the 160 (57) survey areas (class A: pos. angles > 30°;
cf. sect. 7). The number (slightly
smoothed out) of optical companions, as derived from all the comparison
areas, is
listed in the fourth column. It may be recollected that this number
should be multiplied by the factor 0.65/2 (class A), or 0.95/2
(class B - C); the mean factor amounts
to 0.413 in the first diameter class, and to 0.425 in the remaining
classes. The resulting number of physical satellites, in all 274,
appears in the last column. The mean
error listed reflects the accidental fluctuations in the number of
optical companions; it has been derived from the square root of this number.
| log A |  pg pg |
Ntot | Nopt | Nphys | |
| 2.95-3.15 | -11.16 | 363a | 0.413 × 760a | 49a ± 11.4 | |
| 3.15-3.35 | -12.36 | 367 | 0.425 × 675 | 80 11.0 | |
| 3.35-3.55 | -13.56 | 122 | 0.425 × 169 | 50 5.5 | |
| 3.55-3.75 | -14.76 | 48 | 0.425 × 43 | 30 2.8 | |
| 3.75-3.95 | -15.96 | 25 | 0.425 × 10.8 | 20.4 1.4 | |
| 3.95-4.15 | -17.16 | 24 | 0.425 × 2.7 | 22.9 0.7 | |
| 4.15-4.35 | -18.36 | 14 | 0.425 × 0.7 | 13.7 - | |
| 4.35-4.55 | -19.56 | 7 | 0.425 × 0.2 | 6.9 - | |
| 4.55-4.75 | -20.76 | 1 | 0.425 × 0.0 | 1.0 - | |
| a Only galaxies with
m - M 30.0
(57 survey areas); the frequencies should be multiplied by 2.92. |
|||||
It should be pointed out here that the central spiral systems have not been included in the analysis. Since all the survey areas are centered on prominent galaxies, the inclusion of these would lead to a serious over-representation of objects with large diameters. The correct procedure would be to include those :galaxies which would fall within the survey fields, if these fields were distributed at random over the sky. The total area covered by all the fields amounts to about 70 square degrees (the large fields of NGC 224 and 598 being omitted), corresponding to approximately 0.4% of the area covered by the Sky Atlas outside the galactic belt. A random distribution of the survey fields would thus include less than one of the 160 spiral systems.
In the first diameter class, log A = 2.95 - 3.15, the value found for
Nphys must be
multiplied by a.certain factor, in order to be comparable to the other
class frequencies. The 57 survey areas with distance moduli
30.0
contain altogether 77 physical satellites with log. diameters larger
than 3.15, whereas the corresponding number
in all the 160 areas is 225; the factor is 225/77 = 2.92. In the first
class Nphys is thus increased to 143 ± 33. As is
clear from
the large relative size of the mean error, the disturbance from optical
companions is considerable in this class, indicating that attempts to
pursue the survey work to still smaller satellites would not be
successful.
The statistical distribution of log A is reproduced in Fig. 8 on a logarithmic scale. The large open circles (vertical bar = twice the mean error) represent the above class frequencies, whereas the full curve is supposed to give the smoothed-out distribution. In the direction of small diameters there is a steady linear increase in the logarithmic curve, no turning point being indicated, although the material includes diameters down to about 900 pc. On the other hand, there seems to be an unexpected maximum in the distribution for diameters of about 10 kpc. The dotted line represents the distribution of the subtracted optical companions.
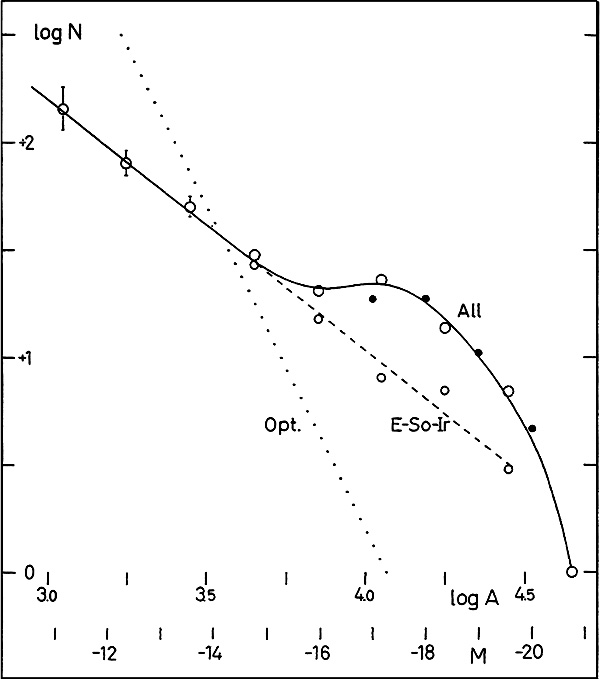 |
Figure 8. Statistical distribution of log. absolute diameter (and absolute pg magnitude), as obtained for 274 satellites in 160 survey areas. The large open circles refer to the entire material, and the small circles to types E-So-Ir; the filled circles represent those satellites for which the absolute magnitudes are based on available apparent magnitudes. |
For the medium-sized and large satellites it is possible to determine the morphological types. A division of the material in two type groups, E-So-Ir and Sa-Sb-Sc, leads to the very interesting result that the distribution corresponding to the former group, as represented by the small open circles, can be described by a straight line that is an extrapolation of the linear part of the total distribution curve. The region between the full curve and the broken line refers to the Sa-Sb-Sc group. The results indicate that there is, as has been suspected before, a definite lower limit for the diameters of Sa-Sb-Sc spirals, about 5 kpc on the present diameter scale, and that the linear part of the distribution curve in its entire length refers to galaxies of types E-So-Ir. The distribution curves will be further discussed in the next two sections.