Copyright © 2000 by Annual Reviews. All rights reserved
| Annu. Rev. Astron. Astrophys. 2000. 38: 289-335
Copyright © 2000 by Annual Reviews. All rights reserved |


4.2. LX- and LX-T Relations
Strong correlations are also found between X-ray luminosity and both
velocity dispersion and gas temperature in groups. However, there is
considerable disagreement in the literature over the nature of these
correlations. Figure 5 shows the
LX-
relationship for all the groups observed by the ROSAT PSPC in
pointed-mode and a sample of clusters observed with various X-ray
telescopes
(Wu et al 1999).
The solid line shows the best-fit relationship
Wu et al (1999)
derived from the cluster sample alone. Figure 5
shows that for the most part, groups are consistent with the cluster
relationship, although there is considerable scatter particularly among
the lowest luminosity groups. This conclusion was reached by
Mulchaey &
Zabludoff (1998),
who found that a single relationship fit their sample of groups and rich
clusters.
Ponman et al
(1996),
Helsdon & Ponman
(2000) also found that the
LX- for
groups was basically consistent with the cluster relationship, although
both studies noted that the relationship may become somewhat flatter for
low velocity dispersion systems. (Within the errors, the slopes derived
by Mulchaey &
Zabludoff (1998),
Ponman et al
(1996),
Helsdon & Ponman
(2000)
are indistinguishable; LX
 4.3,
4.9 and
4.5,
respectively). Therefore, there is fairly good agreement among the ROSAT
studies based on pointed-mode data. However,
Mahdavi et al
(1997)
derived a significantly flatter slope from their ROSAT All Sky Survey
data (LX
1.56)
and suggested that for low velocity dispersion systems the X-ray
emission is dominated by hot gas clumped around individual
galaxies. More recently,
Mahdavi et al
(2000)
presented X-ray luminosities for a much larger sample of loose
groups. In agreement with their earlier result, they find a much flatter
LX- for
groups than for rich clusters.
Mahdavi et al
(2000)
modeled the
LX-
relationship as a broken power law, with a very flat slope
(LX
0.37) for
systems with velocity dispersion less than 340 km s-1 and a
cluster-like value (LX
4.0) for
higher velocity dispersion systems. However, a visual inspection of
Mahdavi et al's
(2000)
LX-
relationship (see Figure 4 of
their paper) reveals that the need for a broken power law fit is driven
by the one or two lowest velocity dispersion groups (out of a total
sample of 61 detected groups.) Furthermore, nearly all the LX
upper limits derived by
Mahdavi et al (2000)
fall below their broken power law relationship (and therefore require a
"steeper" relationship). Thus, the case for deviations from the
LX- cluster
relationship is far from compelling. It is also worth noting that the
velocity dispersions of the groups that appear to deviate the most from
the cluster relationship are often based on very few velocity
measurements (for example the most "deviant" system in
Figures 4 and
5 has a velocity dispersion based on only four
velocity measurements.)
Zabludoff &
Mulchaey (1998)
have found that when velocity dispersions are calculated for X-ray
groups from a large number of galaxies, as opposed to just the four or
five brightest galaxies, the velocity dispersion is often significantly
underestimated. Therefore, more detailed velocity studies of low
velocity dispersion groups could prove valuable in verifying deviations
from the cluster
LX- relation.
4.3,
4.9 and
4.5,
respectively). Therefore, there is fairly good agreement among the ROSAT
studies based on pointed-mode data. However,
Mahdavi et al
(1997)
derived a significantly flatter slope from their ROSAT All Sky Survey
data (LX
1.56)
and suggested that for low velocity dispersion systems the X-ray
emission is dominated by hot gas clumped around individual
galaxies. More recently,
Mahdavi et al
(2000)
presented X-ray luminosities for a much larger sample of loose
groups. In agreement with their earlier result, they find a much flatter
LX- for
groups than for rich clusters.
Mahdavi et al
(2000)
modeled the
LX-
relationship as a broken power law, with a very flat slope
(LX
0.37) for
systems with velocity dispersion less than 340 km s-1 and a
cluster-like value (LX
4.0) for
higher velocity dispersion systems. However, a visual inspection of
Mahdavi et al's
(2000)
LX-
relationship (see Figure 4 of
their paper) reveals that the need for a broken power law fit is driven
by the one or two lowest velocity dispersion groups (out of a total
sample of 61 detected groups.) Furthermore, nearly all the LX
upper limits derived by
Mahdavi et al (2000)
fall below their broken power law relationship (and therefore require a
"steeper" relationship). Thus, the case for deviations from the
LX- cluster
relationship is far from compelling. It is also worth noting that the
velocity dispersions of the groups that appear to deviate the most from
the cluster relationship are often based on very few velocity
measurements (for example the most "deviant" system in
Figures 4 and
5 has a velocity dispersion based on only four
velocity measurements.)
Zabludoff &
Mulchaey (1998)
have found that when velocity dispersions are calculated for X-ray
groups from a large number of galaxies, as opposed to just the four or
five brightest galaxies, the velocity dispersion is often significantly
underestimated. Therefore, more detailed velocity studies of low
velocity dispersion groups could prove valuable in verifying deviations
from the cluster
LX- relation.
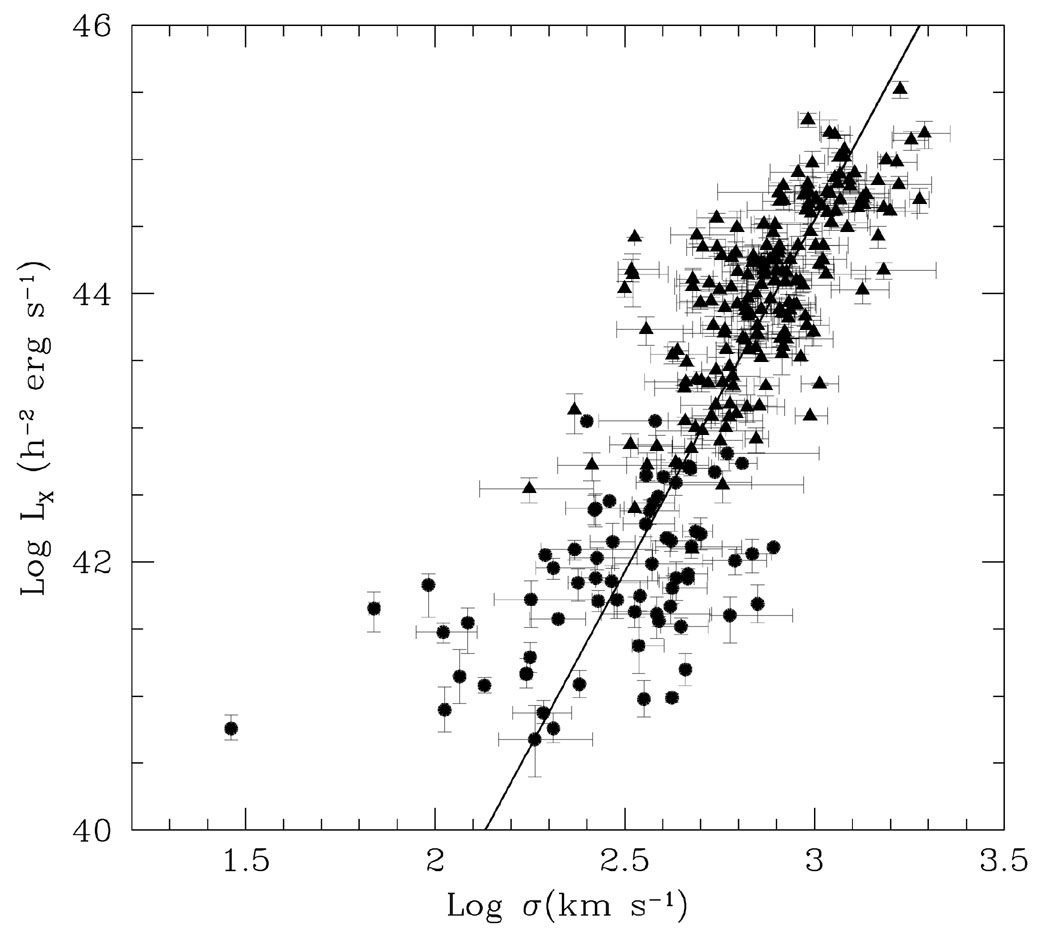 |
Figure 5. Logarithm of optical velocity dispersion versus logarithm of X-ray luminosity for a sample of groups (circles) and clusters (triangles). The data are taken from the same sources cited in Figure 4. The solid line represents the best-fit found by Wu et al (1999) for the clusters sample (using an orthogonal distance regression method). |
There is also considerable disagreement in the literature about the
relationship between X-ray luminosity and gas temperature.
Mulchaey &
Zabludoff (1998)
found that a single LX-T relationship could describe groups
and clusters (LX
T2.8). However, both
Ponman et al
(1996),
Helsdon & Ponman
(2000)
found much steeper relationships for groups (LX
T8.2 and
LX
T4.9,
respectively). These differences might be attributed to the different
temperature ranges included in the studies.
Mulchaey &
Zabludoff's (1998)
sample was largely restricted to hot groups (i.e. ~ 1 keV), whereas
Ponman and collaborators have included much cooler systems (down to ~
0.3 keV). Indeed,
Helsdon & Ponman
(2000)
found that the steepening of the LX-T relationship appears to
occur below about 1 keV. Figure 6 suggests that
the deviation of the cool groups from the cluster relationship is indeed
significant. The fact that the
LX-
relationship for groups appears to be similar to the relationship found
for clusters, while the relationships involving gas temperature
significantly depart from the cluster trends, may be an indication that
non-gravitational heating is important in groups
(Ponman et al 1996,
Helsdon & Ponman
2000).
However, the group X-ray luminosities may be biased somewhat low because
groups are detected to a smaller fraction of their virial radius than
richer systems, and if comparisons are made at the same mass
over-density level, groups would likely fall closer to the cluster
relation.
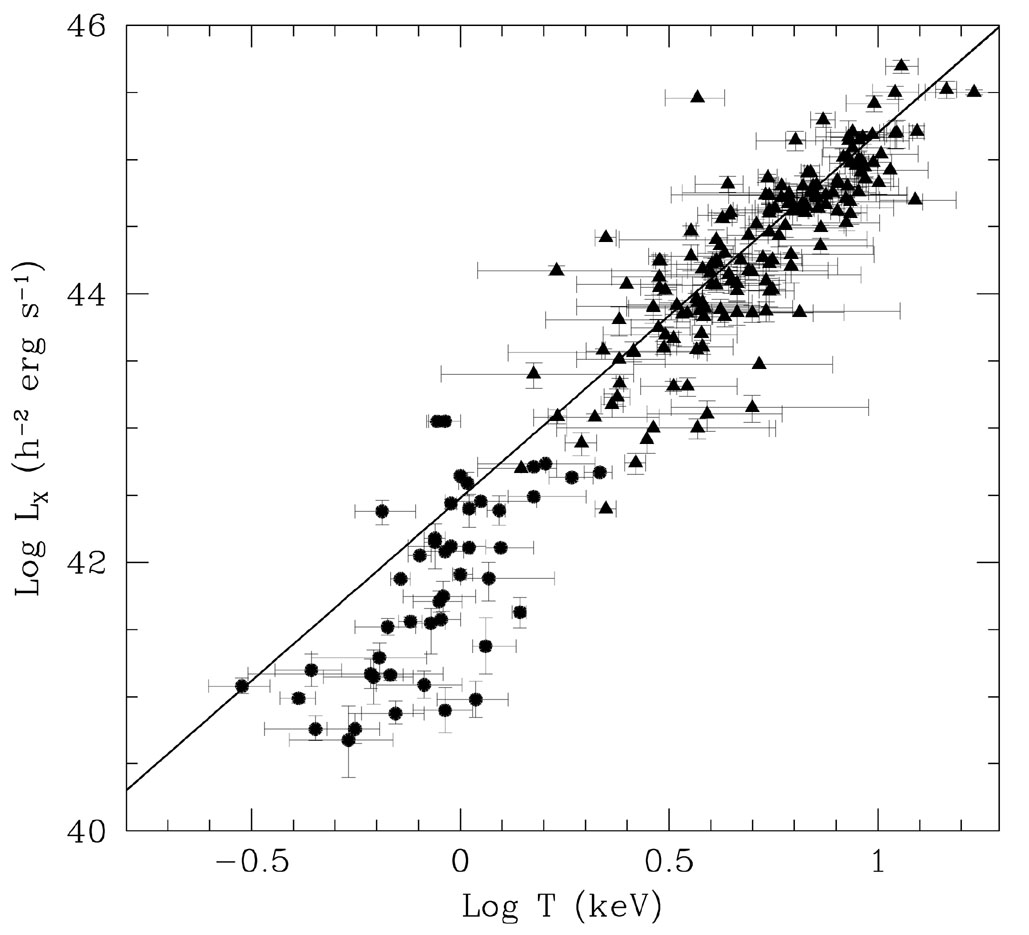 |
Figure 6. Logarithm of the X-ray temperature versus logarithm of X-ray luminosity for a sample of groups (circles) and clusters (triangles). The data are taken from the same sources cited in Figure 4. The solid line represents the best-fit found by Wu et al (1999) for the clusters sample (using an orthogonal distance regression method). The observed relationship for groups is somewhat steeper than the best-fit cluster relationship. |