


The Chandra calibration observation of the Hydra A cluster of galaxies is shown in figure 6 (from McNamara (2000) and Nulsen (2002)). Hydra A had been inferred to have a large cooling flow, of order 250 solar masses per year (White (1997)). However, only of order 10 solar mass per year could be accounted for by star formation rates (McNamara (1995), Hansen (1995)). A general suggestion to prevent cooling flows condensing in cluster centers was that radio sources in the central cD galaxy provided the energy to balance the radiation loss (cf. Tucker & Rosner (1983)). A convential picture was that the radio plasma was emitted in a jet, which generated a shock upon colliding with the cluster gas (Clarke (1997), Heinz (1998)).
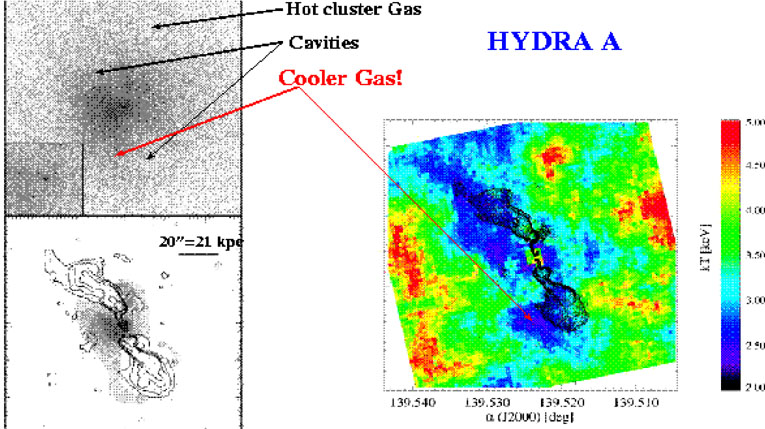 |
Figure 6. X-ray (gray scale and false color) image and 6 cm contours of the central region of the Hydra A cluster. (Left, from McNamara (2000); right from Nulsen (2002).) |
The left panel of Figure 6 was discussed by McNamara (2000), who emphasized the coincidence of the apparent "cavity" in the X-ray emission (gray scales in top and bottom panels) with the 6 cm VLA emission (contours in bottom panel, from Taylor (1990)). However, as shown in the temperature map of the cluster by Nulsen (2002), (right panel), the higher density gas surrounding the cavities is at a lower temperature than the more distant cluster gas, and thus is not the result of a strong shock. This leads to the interpretation that the "cavity" is actually a buoyantly rising "bubble."
We can use the X-ray observations to learn much about the conditions
in cluster cores in general. We can measure, as a function of
position, the electron temperature, T, from the shape of the X-ray
spectrum, and the density ne from the measured intensity,
which is proportional to ne2
T1/2. The
coincidence of the X-ray cavities with the radio emission gives us
three more relations: The work,
p V, done to create
the cavity
should equal the energy available from the radio jet; the pressure of
the radio plasma should approximately balance the X-ray gas pressure
at the cavity boundaries; and the time scale for the bubble to rise
and expand, gives lifetimes. In particular, both the observation that
the bubbles do not expand faster than the sound speed (due to lack of
strong shocks), and the estimate that they rise with a velocity of
order the Keplarian velocity at their position
(Churazov
(2000)),
leads to velocities of order hundreds of km/s, and ages of a few
107 years.
V, done to create
the cavity
should equal the energy available from the radio jet; the pressure of
the radio plasma should approximately balance the X-ray gas pressure
at the cavity boundaries; and the time scale for the bubble to rise
and expand, gives lifetimes. In particular, both the observation that
the bubbles do not expand faster than the sound speed (due to lack of
strong shocks), and the estimate that they rise with a velocity of
order the Keplarian velocity at their position
(Churazov
(2000)),
leads to velocities of order hundreds of km/s, and ages of a few
107 years.
In the case of Hydra A,
Nulsen (2002)
estimate pV
 1.2 ×
1059 ergs, while if one assumes the magnetic field and
particles in the radio plasma have a minimum energy density (which is
very nearly the equipartition value) this density times the
volume is only ume V
1.4 ×
1058 ergs. On
the other hand, based on the rotation measure,
Taylor (1990)
argue that the magnetic field is several times less than the equipartition
value, and if so the energy in the radio plasma could be comparable to
the work done creating the cavities.
1.2 ×
1059 ergs, while if one assumes the magnetic field and
particles in the radio plasma have a minimum energy density (which is
very nearly the equipartition value) this density times the
volume is only ume V
1.4 ×
1058 ergs. On
the other hand, based on the rotation measure,
Taylor (1990)
argue that the magnetic field is several times less than the equipartition
value, and if so the energy in the radio plasma could be comparable to
the work done creating the cavities.
The remarkable original discovery of cluster gas cavities coincident with radio emission was made by Böhringer (1993) using ROSAT high resolution imager observations of the Perseus Cluster. This cluster contains the powerful radio source 3C 84. The original Chandra observations are shown in Figure 7, from Fabian (2000) (left panels) and Fabian (2002) (right panels). We see the original cavities, (also called "holes"), within about 10 kpc nearly N and S of the cluster center. Chandra data shows that the X-ray bright rims of the holes are cooler, about 2.7 keV, than the extended cluster emission which is at about 6.5 keV (Fabian (2000)). As in the case of Hydra A, the cavities therefore could not be interpreted as shock heating by the radio plasma as predicted, e.g. by Heinz (1998).
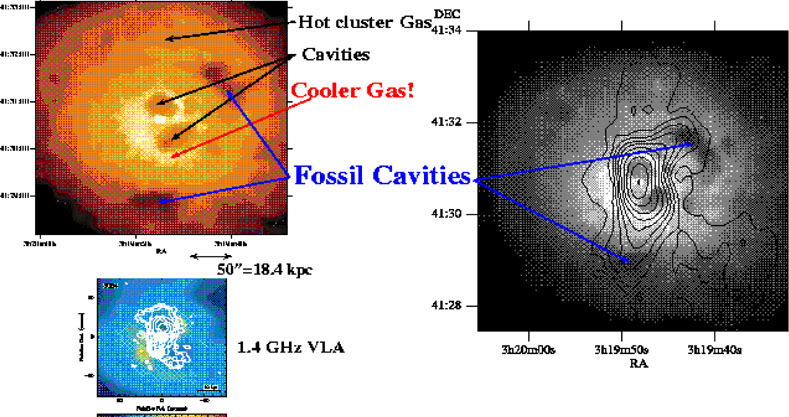 |
Figure 7. Left panels (from Fabian (2000), figs. 5 and 7): False color X-ray image of the center of the Perseus cluster, showing the inner X-ray cavities filled with 1.4 GHz emission. Right panel (from Fabian (2002), Fig. 3): gray scale X-ray image, showing the 74 MHz radio contours extending to the outer "fossil" cavities. |
The work to evacuate the North cavity is about
p V
2 ×
1058 ergs. A standard minimum energy
calculation, which takes a filling factor
 = 1 and a ratio of
proton to electron energy density k = 0, gives ume
V
4 ×
1056 ergs, almost a factor of 100 smaller.
Fabian (2002)
use this to infer that the ratio
(k + 1) /
is of order 600, and at least 180 to establish pressure
equality, all under conditions of minimum energy. On the contrary, in
order that the synchrotron lifetime of the electrons emitting at 1.4
GHz be longer than the age of the N cavity,
Fabian (2002)
find that the magnetic field is 4 to 10 times less than equipartition
value, (which also requires (k + 1) /
< 500).
= 1 and a ratio of
proton to electron energy density k = 0, gives ume
V
4 ×
1056 ergs, almost a factor of 100 smaller.
Fabian (2002)
use this to infer that the ratio
(k + 1) /
is of order 600, and at least 180 to establish pressure
equality, all under conditions of minimum energy. On the contrary, in
order that the synchrotron lifetime of the electrons emitting at 1.4
GHz be longer than the age of the N cavity,
Fabian (2002)
find that the magnetic field is 4 to 10 times less than equipartition
value, (which also requires (k + 1) /
< 500).
The regions of lower surface brightness 1.5' to the NW and 2' to the S, are interpreted by Fabian (2002) as due to bubbles for which the high frequency emission is absent due to ageing of the radio electrons. They argue that the 74 MHz radio images (Blundell (2002)) which point to these "fossil" or "relic" cavities, trace earlier radio jets which evacuated and energized these regions.
The mechanism by which the central, active radio source provides the energy to balance the cooling flow may have been seen directly in a 200 ks observation of Perseus A (Fabian (2003)). They explore the possibility that faint X-ray intensity ripples (seen in their Figure 3.) are sound waves moving out from the interaction of the jets producing the bubbles. Since they do not detect any temperature variations in these regions, density oscillations most economically explains the intensity variations. They invoke viscosity to dissipate the sound energy into the required heating of the gas.
The lesson of all the bubbles in X-ray clusters (e.g., Blanton (2001), McNamara (2001), Sanders & Fabian (2002), Sun (2003)) is that the central black hole must be producing much more energy than we see from the direct radio emission or from the minimum energy arguments. It is therefore likely that a central active galaxy produces the energy output needed to counteract the cooling flows. Nulsen (2003) argues that this proceeds via a feedback process, whereby the central AGN becomes more active whenever the cooling gas can effectively accrete to the central black hole, and the increased activity then retards or stops the cooling flow.