

 < 1.0
µm
< 1.0
µmIn this section we compare our results with those of three previous photometric studies of the nuclei of early-type galaxies and of the integrated light of globular clusters -- O'Connell (1976a), Faber (1973b), and McClure and van den Bergh (1968).
Nineteen E and S0 galaxies were observed photoelectrically by
O'Connell (1976a)
in the extreme red region of the optical spectrum, mostly through a
12" diameter aperture. The results of immediate interest here may be
summarized as follows:
A(1.0 - 0.74)0 color, which is insensitive to
blanketing effects, shows a "mild color-luminosity dependence" over the
range -22 < MV < - 16. However, if the faintest
galaxies are excluded, then
O'Connell's data are consistent with a constant (1.0 - 0.74)0
color for MV < - 19.
This color is "equivalent to an M0-1 III star." O'Connell also found
that the strength of the Ca II+TiO
 8542 feature (which is
positively correlated with
luminosity in giant stars), rather than increasing monotonically with
absolute galaxian magnitude, reaches a maximum near
MV = - 20, and then declines with increasing
luminosity. He interprets this as a decrease in the luminosity
of the late M giants in the brightest galaxies due to the increased metal
content of these systems.
All but one of O'Connell's galaxies were observed by us through either a 15" or a 16".5 diameter aperture. These observations were taken from Table 1 and divided into the same three luminosity groups used by O'Connell. The colors and CO index showed no statistically significant variation from group to group. These results did not change when other galaxies with 15" or 16".5 observations from Table 1, and having reliable distance estimates, were included in the averaging.
To carry this comparison further, we use the averaged colors from Table 7. Although these measurements refer to a much larger fraction of the light than that measured by O'Connell, these data are expected to have smaller uncertainties than the small aperture data, and they substantially increase the sample size. From the decrease in Ca II + TiO strength for MV < - 20, one might expect to see some effect in the infrared colors, especially in V - K. Table 7 shows no evidence that any of the colors become bluer with increasing luminosity. A much larger sample of galaxies is needed to proceed further with this puzzling comparison (cf. Paper III).
b) The Work of McClure and van den Bergh and of Faber
McClure and van den Bergh (1968) and Faber (1973b) observed the central regions of a number of E/S0 galaxies and the integrated light of globular clusters with sets of narrow bandpass filters chosen to isolate specific spectral features primarily in the blue and visible. The UV blanketing feature measured by McClure and van den Bergh (1968) (defined by them as C* [38 - 45]) was found to be strongly correlated with Q, the reddening-free metallicity index. Based on these results and on model fitting, they concluded that dwarf ellipticals consist primarily of metal-deficient stars, that the cores of giant ellipticals consist of metal-rich stars with strong CN bands, and that these cores are embedded in a metal-poor halo. Additional evidence for the presence of a stellar population with strong CN bands in the nuclei of galaxies has been presented by McClure (1969), Spinrad et al. (1971), Welch and Forrester (1972), and Spinrad, Smith, and Taylor (1972), among others.
Faber's (1973b) observations of galaxies and globulars led her to the following conclusions: (a) all of the colors depend on only one parameter -- the luminosity of the galaxy; (b) the scatter in the data at a given MV comes mostly from residual reddening errors and from observational errors; and (c) a monotonic increase in mean metallicity with luminosity seemed the most likely explanation for the observed variation in the various indices.
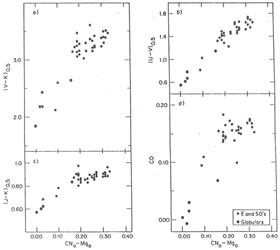
In Figure 7 we compare the values of (U - V)0.5, (V - K)0.5, (J - K)0.5 , and CO for the galaxies and the globulars from Tables 2 and 5 with the CN0 - Mg0 line index of Faber (1973b). Some of the measurements of McClure and van den Bergh were transformed to the CN0 - Mg0 index via a comparison of objects in common and were added to Figure 7. The correlations seen in Figure 7 are in qualitative agreement with those expected from the relations between Faber's line index and absolute magnitude and from our own results in Figure 6, in that the colors and CO index are seen to increase monotonically with increasing CN0 - Mg0. A slight curvature may be present in Figure 7 (c), and this could be another piece of evidence for a relative insensitivity of the infrared colors of brighter galaxies to changes in MV. Aside from this, latter point, though, the data in Figures 5, 6, and 7 are in basic agreement with Faber's (1973b) main conclusions.
 |
Figure 7. Colors and CO indices for galaxies from Table 4 and for globular clusters from Table 2 are shown as functions of Faber's (1973b) CN0 - Mg0 index. |