


The observed values of the H2O index for the galaxies and
globular clusters are presented in
Tables 3 and
4, respectively. Unless noted otherwise,
the 1 terrors in the photometry are ± 0.02 mag. For the values of
Av
appropriate to the objects in these tables, no reddening corrections need be
applied to the H2O indices. Unlike the K-correction
for the CO index where
the absorption feature is shifted out of the filter bandpass for
z > 0, the center of the H2O band is shifted into
the filter bandpass
for z < 0.05. An analytic redshift correction based on stellar
observations could not be
determined, as in Paper I, because the data requires significant
extrapolation past the wavelength of atmospheric cutoff. An attempt to
derive the K-correction empirically as was done in Paper I for the CO
index is hampered by the more limited sample of galaxies and the
apparently small size of the correction. Since the indicated result was
0  KH2O < 1.3z, and
only 5 galaxies in Table 3 have redshifts
z > 0.01 (the largest being z = 0.022), we have chosen
to apply no redshift correction to the data.
KH2O < 1.3z, and
only 5 galaxies in Table 3 have redshifts
z > 0.01 (the largest being z = 0.022), we have chosen
to apply no redshift correction to the data.
| Galaxy/Type | Telescope | Aperture | Log A/ D(0) | H2O Index |
| (inches) | Diameter | |||
| (arc sec) | ||||
| (1) | (2) | (3) | (4) | (5) |
| NGC 1600 | 200 | 15 | -0.69 | 0.14 |
| E4 | ||||
| NGC 1700 | 200 | 15 | -0.75 | 0.125 |
| E3 | ||||
| NGC 2300 | 200 | 15 | -0.68 | 0.135 |
| E3 | 60 | 48 | -0.18 | 0.11 |
| NGC 2549 | 200 | 15 | -0.88 | 0.115 |
| S01(7) | 60 | 48 | -0.38 | 0.115 |
| NGC 2634 | 200 | 15 | -0.50 | 0.145 |
| El: | 60 | 48 | +0.01 | 0.105 ± 0.04 |
| NGC 2655 | 200 | 15 | -1.14 | 0.11 |
| SAB(s) 0 | 60 | 48 | -0.63 | 0.105 |
| NGC 2672 | 200 | 15 | -0.65 | 0.135 |
| E2 | ||||
| NGC 2768 | 200 | 15 | -0.98 | 0.115 |
| E6 | 60 | 48 | -0.48 | 0.115 |
| NGC 2974 | 200 | 15 | -0.75 | 0.135 |
| E4 | ||||
| NGC 3115 | 200 | 15 | -1.04 | 0.13 |
| E7/S01(7) | 84 | 37.5 | -0.64 | 0.13 |
| 60 | 48 | -0.54 | 0.135 | |
| 36 | 106.4 | -0.19 | 0.145 | |
| NGC 3193 | 200 | 15 | -0.78 | 0.10 |
| E2 | ||||
| NGC 3377 | 200 | 15 | -0.90 | 0.10 |
| E6 | ||||
| NGC 3379 | 200 | 15 | -0.96 | 0.11 |
| E0 | 60 | 48 | -0.46 | 0.1.05 |
| NGC 3384 | 200 | 15 | -1.01 | 0.10 |
| SB01(5) | ||||
| NGC 3607 | 200 | 15 | -0.83 | 0.115 |
| S03(3) | ||||
| NGC 3608 | 200 | 15 | -0.70 | 0.10 |
| E1 | ||||
| NGC 3998 | 200 | 15 | -0.83 | 0.12 |
| S01(3) | ||||
| NGC 4278 | 200 | 7.5 | -1.17 | 0.16 |
| E1 | 200 | 15 | -0.87 | 0.145 |
| 200 | 16.5 | -0.82 | 0.105 | |
| 60 | 48 | -0.36 | 0.09 | |
| NGC 4283 | 100 | 30 | -0.23 | 0.07 |
| E0 | ||||
| NGC 4365 | 200 | 15 | -1.09 | 0.125 |
| E3 | ||||
| NGC 4374 | 200 | 7.5 | -1.28 | 0.12 |
| E1 pec | 200 | 15 | -0.98 | 0.09 |
| 60 | 48 | -0.48 | 0.115 | |
| NGC 4382 | 200 | 15 | -1.20 | 0.11 |
| S01(3) | ||||
| NGC 4406 | 200 | 7.5 | -1.37 | 0.095 |
| E2 | 200 | 15 | -1.07 | 0.115 |
| 60 | 48 | -0.57 | 0.135 | |
| NGC 4459 | 200 | 15 | -0.81 | 0.12 |
| S03(3) | ||||
| NGC 4472 | 200 | 7.5 | -1.56 | 0.15 |
| E2 | 200 | 15 | -1.26 | 0.125 |
| 200 | 16.5 | -1.22 | 0.105 | |
| 60 | 48 | -0.75 | 0.10 | |
| NGC 4478 | 200 | 15 | -0.65 | 0.125 |
| E2 | ||||
| NGC 4486 | 200 | 7.5 | -1.48 | 0.145 |
| E0 | 200 | 15 | -1.18 | 0.125 |
| 60 | 48 | -0.68 | 0.105 | |
| NGC 4486A | 200 | 7.5 | -- | 0.085 |
| 200 | 15 | -- | 0.075 | |
| NGC 4486B | 200 | 7.5 | -0.40 | 0.12 |
| EO | 200 | 15 | -0.10 | 0.065 |
| NGC 4494 | 100 | 30 | -0.58 | 0.13 ± 0.04 |
| E1 | ||||
| NGC 4649 | 200 | 15 | -1.10 | 0.12 |
| E2/S0 | ||||
| NGC 4889 | 200 | 15 | -0.71 | 0.125 |
| E4 | ||||
| NGC 5813 | 200 | 15 | -0.86 | 0.095 |
| E1 | 100 | 30 | -0.56 | 0.095 |
| NGC 5846 | 100 | 30 | -0.60 | 0.155 |
| E1 | 60 | 48 | -0.40 | 0.11 |
| NGC 5866 | 100 | 30 | -0.66 | 0.135 |
| S03(8) | ||||
| NGC 5982 | 200 | 7.5 | -0.95 | 0.095 |
| E3 | 200 | 15 | -0.65 | 0.125 |
| 100 | 30 | -0.35 | 0.135 | |
| NGC 6702 | 100 | 30 | -0.18 | 0.075 |
| E2 | ||||
NOTE. - The values of
log A / D(0) refer to the aperture size in units of the
major diameter D(0)
(de Vaucouleurs and de
Vaucouleurs 1964).
The morphological types were made available to us by Dr. A. Sandage
(1977 private communication).
One |
||||
| Cluster | Aperture Diameter (arcsec) | [Fe/H]1 | H2O Index |
| M3 | 105. | -1.5 | 0.01 |
| M13 | 105. | -1.6 | 0.035 |
| M15 | 105. | -1.9 | 0.035 |
| M69 | 66.4 | > -0.4 | 0.07 |
| M92 | 105. | -2.2 | 0.025 |
1 For M3, M13, M15, and M92, [Fe/H] is from Hesser, Hartwick, and McClure (1976). For M69, [Fe/H] is an estimate based on the results of Hartwick and Sandage (1968). |
|||
In Figure l the data from Table 3 are plotted as a function of log A / D(0). No obvious dependence of the H2O index on radius is seen in this diagram. As was done for the CO data of Paper I, a least squares fit to the multiaperture data for each galaxy was made, and the resulting values for the individual slopes were averaged. The mean change in the H2O index per unit change in log A / D(0) is -0.04± 0.02 mag. Thus for our limited sample we find no significant dependence of the H2O index on radius.
 |
Figure 1. The H2O indices from Table 3 are plotted as a function of log A / D(0). |
We have also searched for a dependence of the H2O index on galaxian absolute magnitude. Table 5 presents a binning of the 15" aperture data into the same MV bins as in Paper I. It is apparent that no significant dependence of H2O index on MV exists for MV < - 19. Although the ordering by MV is also an ordering by increasing z, and no redshift correction has been applied, the largest allowable correction will not significantly affect this conclusion. This result differs from that of O'Connell (1976a), who found that a Ca II + TiO index, which also increases toward late spectral type for M giants, decreases with increasing galaxian luminosity for MV < - 19. Radial gradients in either index are not likely to affect this comparison since the aperture size used by O'Connell is close to ours. This difference remains if we restrict our sample to only those 10 galaxies observed in common with O'Connell. This and other absolute magnitude effects will be discussed further in Paper III (Persson, Frogel, and Aaronson 1977).
| MV1.0 Limits | NO. | <z> | H2O Index * |
| MV < - 22.8 | 3 | 0.0170 | 0.13 (± 0.01) |
| -22.8
MV
< - 21.8 |
9 | 0.0058 | 0.12 (± 0.02) |
| -21.8
MV < - 20.8 |
8 | 0.0037 | 0.115 (± 0.01) |
| -20.8
MV < - 19.8 |
8 | 0.0033 | 0.115 (± 0.02) |
* Indices for an aperture diameter of 15" were averaged. The errors in parentheses are the dispersions. |
|||
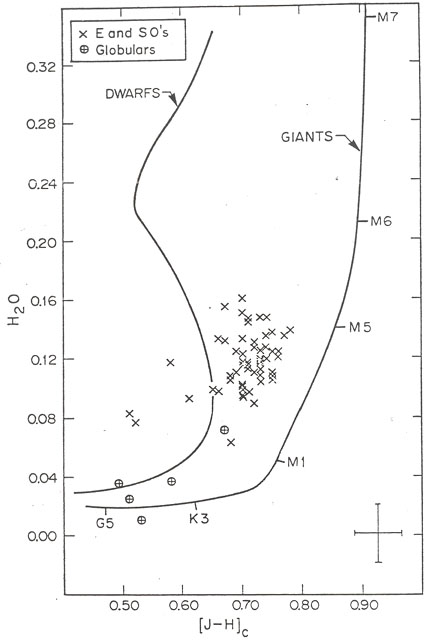
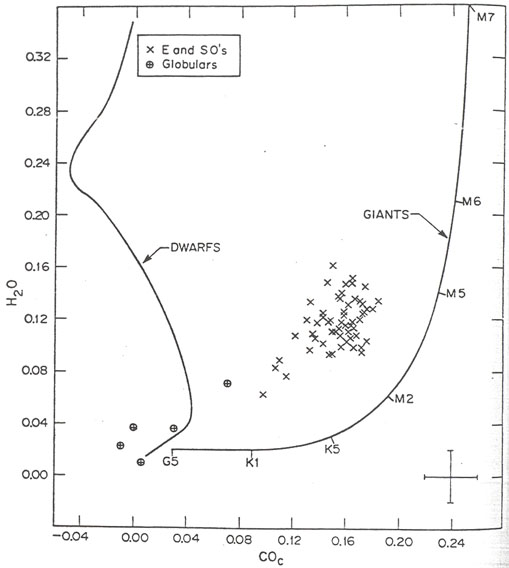
Figure 2 displays the relationship between the H2O data of Tables 3 and 4 and the corrected CO and broad-band color data from Paper I for the same or similar aperture size. Also shown are the mean relationships from Table 2. The relative location of the galaxies on the H2O versus V-K, J-H, and H-K plots is determined by the fact that we are sampling the light of a composite stellar population. Thus, as was pointed out in Paper I, the V-K color is dominated by a hotter population of stars than is the H-K color. This accounts qualitatively for the relatively large displacement of the galaxy data from the mean relation for giants in the H2O versus V-K plot. Now the data of Paper I showed that the 2.2 µm radiation from these galaxies is dominated by giant stars. Since the measured strength of the H2O indices for these galaxies corresponds to that of an M5 III star, we conclude that late M giants must also make a significant contribution to the infrared light of early-type galaxies. O'Connell (1976a, b) came to a similar conclusion on the basis of his Ca II + TiO measurements.
 |
 |
 |
 |
Figure 2. The H2O indices from Tables 3 and 4 are plotted against the corrected CO indices and broad-band colors from Paper I. Mean relations shown for giant and dwarf stars are taken from Table 2 and from Paper I. The behavior of the mean relationships for dwarf stars is discussed by Persson et al. (1977), and the dependence of J-H on Teff for dwarfs is discussed by Mould and Hyland (1976). The dependences of the H2O index on colors for late-type stars (M5 and beyond) show large dispersion. Galaxy measurements from Table 3 are not plotted unless data at similar aperture sizes are available from Paper 1. In the H2O versus V-K plot, all such points lie within the ellipsoid labelled "galaxies." |
In order to put this result on a more quantitative basis we compare: the
predictions of the models of
Tinsley and Gunn (1976,
TG, model A) and
O'Connell (1976b,
OC, model C)
with the data of Table 3. This comparison is
presented in Table 6, where the mean observed
values are from Table 7 of
Paper I and from of the
present paper. The percentage contributions to the light at 2
µm coming from
three stellar "bins" were computed for the two models and the results are
listed in the table. As was concluded in Paper I, the relative importance
of late M giants in the OC model compared to the TG model leads to better
agreement with the observations. For the H2O index this occurs
because the index increases rapidly in the latest giants.
Tinsley and Gunn (1976)
have suggested that the inclusion of carbon stars
could improve the fit of their model. Because of the single sideband
nature of the H2O and CO indices however, a strong
temperature sensitive term
is included, and the indices do not behave in carbon stars as they do in
ordinary late-type giants (see Section III
and Tables 1 and
2). Therefore,
carbon stars alone cannot help, since the addition of any of these
stars will drive the CO index, already too small in the TG model, to even
lower values. Because of the large H2O and CO absorption in
Mira stars, it would appear that some contribution from these to the
light at 2 µm could
be present. However, we find that no combination of Mira and carbon stars
added to the TG model produces as good a fit to the infrared data as does
the OC model. Furthermore, the allowable contribution of these stars to
the TG model cannot be greater than 15% to the light at 2 µm
without producing disagreement with the data.
Finally, as was the case for the data of Paper I, we find no sharp
discontinuity between the globular clusters and the galaxies in
Figure 2; the
globular with the strongest H2O absorption is M69, the most metal-rich one observed. Detailed
discussion of the colors and indices of globular clusters
and of individual cluster stars will be presented elsewhere.
We thank our colleagues at Caltech and Harvard for their encouragement
and for help in making the observations. We also thank an anonymous referee
for valuable comments. This work was supported in part by NSF grant
AST -74-18555A2 and NASA grant 05-002-207.
Index
TG
OC
Observed
H2O
0.08
0.12
0.12
CO
0.14
0.16
0.16
V - K
2.97
3.29
3.33
% Contribution to the 2.2 µm
light from:
M6 III bin
12%
37%
-
KO III to M5 III bins
68%
42%
-
All dwarfs and turnoff stars
20%
21%
-
Note: TG:
Tinsley and Gunn (1976),
model A; OC:
O'Connell (1976b),
model C.
 m errors in
the H2O indices are ± 0.02 mag unless noted
otherwise.
m errors in
the H2O indices are ± 0.02 mag unless noted
otherwise.