


1.7. Example interferometer results
The first interferometric map of the SZ effect, shown in
Fig. 7, was made by
Jones (1993)
using a Ryle telescope observation of the cluster Abell 2218 which lies at
z  0.17
(compare Fig. 3). When
making a map of such data, it is normal to include only the short
baselines where the SZ signal is strongest: longer baselines
contribute extra thermal noise, and have already been used to locate
and remove a number of confusing radio sources. The result of
censoring the baselines is that the maps have limited angular dynamic
range. The agreement of the SZ brightness recorded for Abell 2218 with
previous single-dish measurements established the credibility of SZ
effect research.
0.17
(compare Fig. 3). When
making a map of such data, it is normal to include only the short
baselines where the SZ signal is strongest: longer baselines
contribute extra thermal noise, and have already been used to locate
and remove a number of confusing radio sources. The result of
censoring the baselines is that the maps have limited angular dynamic
range. The agreement of the SZ brightness recorded for Abell 2218 with
previous single-dish measurements established the credibility of SZ
effect research.
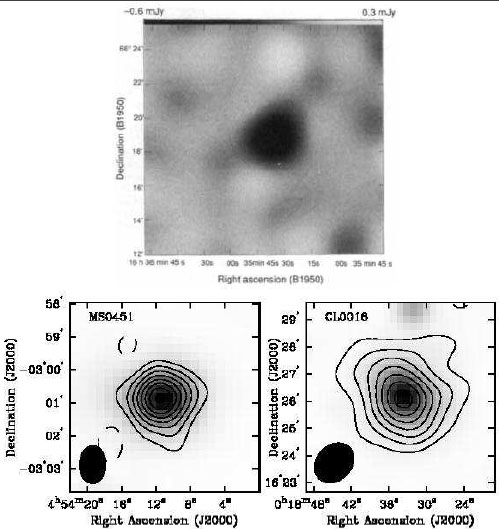 |
Figure 7. Top: This Ryle telescope observation of Abell 2218 was the first interferometric detection of the SZ effect. Below: The OVRO and BIMA arrays have also observed many clusters in SZ, including these high significance detections of MS 0451-0354 and CL 0016+16. |
The BIMA and Owens Valley Radio Observatory (OVRO) arrays have also made many SZ detections, including CL 0016+16 (BIMA) and a highly significant detection of CL 0451-0354 (OVRO). Both are shown in Fig. 7 which was taken from Reese (2000). The high signal/noise SZ effect detections apparent in Fig. 7 can be achieved by long and repeated integrations.
The obvious improvement that could improve the quality of SZ observations is to design an interferometer to overcome the difficulties of using "normal" interferometers. Baselines can be tuned for optimum SZ effect detection over some redshift range (i.e. range of angular sizes), and longer baselines can be added to facilitate the removal of radio sources. An example of such a system now in operation is the Very Small Array (VSA; Lancaster 2004).
The VSA (Fig. 8), is a table-mounted
interferometer run by
groups at the Cavendish Laboratory in Cambridge, Jodrell Bank
Observatory at the University of Manchester, and the Instituto de
Astrofisica de Canarias in Tenerife. The telescope was specifically
designed to make observations of both primordial anisotropies in the
MBR and SZ effects from galaxy clusters. Its range of baselines
(40 < b <
300 at 34GHz) make it
particularly well
suited for observing low-redshift clusters, and observations of a
sample of low-redshift clusters are presented in
Lancaster (2004).
Fig. 9 shows the predicted VSA
visibilities (flux density as a function of baseline; compare
Fig. 6) for the seven z <
0.1 clusters in this X-ray selected sample.
< b <
300 at 34GHz) make it
particularly well
suited for observing low-redshift clusters, and observations of a
sample of low-redshift clusters are presented in
Lancaster (2004).
Fig. 9 shows the predicted VSA
visibilities (flux density as a function of baseline; compare
Fig. 6) for the seven z <
0.1 clusters in this X-ray selected sample.
 |
Figure 8. The VSA is a dedicated MBR interferometer located at the Observatorio del Teide, Tenerife. Each aperture is about 40 cm in diameter and the table is approximately 3 m across. |
 |
Figure 9. Predicted visibilities for VSA
measurements of a sample of
seven X-ray selected clusters at z < 0.1. The shortest VSA
baseline is |
Each cluster was observed for around 100 hours, resulting in some high signal to noise detections, as shown for seven clusters in Fig. 10. All six maps appear noisy -- the noise features are confusion from primordial MBR fluctuations, which are relatively powerful on the range of angular scales defined by the baselines used for these maps. Multi-wavelength observations capable of removing the primordial MBR structures are needed for improved sensitivity on these angular scales.
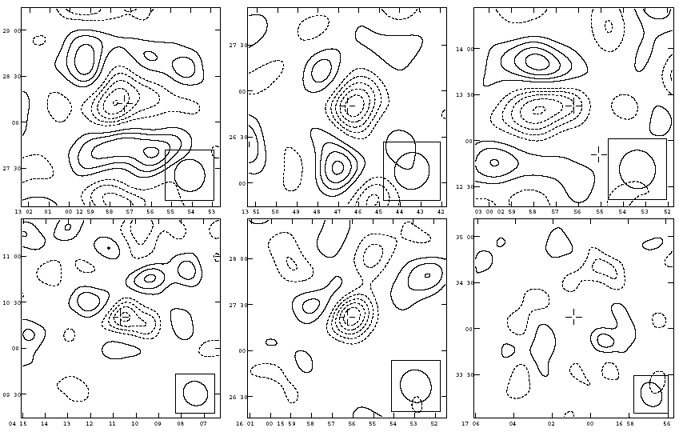 |
Figure 10. VSA maps of seven nearby
clusters. Top row, left to right:
Coma, Abell 1795, Abell 399 / 401 (Abell 399 is further south).
Bottom row, left to right Abell 478, Abell 2142 and Abell 2244.
Coma, Abell 1795, Abell 478 and Abell 2142 are detected.
Contamination from the primordial MBR is evident in all maps. Contours are
1.5 |
Interferometric SZ observations are now becoming almost routine, even
at z 1. There
have been around 50 cluster detections to date, mostly with
non-ideal telescopes, but these are more than adequate to the task.
Fig. 11, taken from
Carlstrom et al. (2002)
shows twelve high significance (better than
10 ) examples -- many of
which have been confirmed by observations with multiple
telescopes. The wide range of redshifts of clusters in
Fig. 11 demonstrates the potential for using SZ
effects to study clusters throughout their histories.
) examples -- many of
which have been confirmed by observations with multiple
telescopes. The wide range of redshifts of clusters in
Fig. 11 demonstrates the potential for using SZ
effects to study clusters throughout their histories.
 |
Figure 11. OVRO/BIMA maps of galaxy clusters in SZ. Such observations are now becoming routine, often resulting in high-significance detections. |