


3.1. X-ray data
ASCA and ROSAT studies of CL 0016+16 showed the
cluster to have a somewhat elliptical shape and a gas temperature of
about 7.6 keV
(Hughes and Birkinshaw
1998).
However the errors on the structural parameters of the gas
( and
and
 c) in
(25) and on the temperature remained a limiting factor in
the interpretation of the cluster. XMM-Newton observations of
the cluster were therefore made to provide better measurements of the
properties of the atmosphere. A full description of the treatment of
the data is given in
Worrall and Birkinshaw
(2003).
c) in
(25) and on the temperature remained a limiting factor in
the interpretation of the cluster. XMM-Newton observations of
the cluster were therefore made to provide better measurements of the
properties of the atmosphere. A full description of the treatment of
the data is given in
Worrall and Birkinshaw
(2003).
The XMM-Newton observation of CL 0016+16 took 37 ks of data
of which rather little was lost to particle flares. An image of the
cluster formed from the combined dataset from the three cameras on XMM
is shown in Fig. 13.
The overall structure of the cluster is somewhat elliptical, but
relatively smooth. To first order in the ellipticity we can take the
cluster to be circularly-symmetric, and fit the radial profile using
the isothermal
model,
eq. (25). The fit is good
(Fig. 14), and yields structural parameters
= 0.70
± 0.01 and a core radius
c = 36 ±
1 arcsec (corresponding to a linear core radius
rc = 240 ± 10 kpc in the standard cosmological
model).
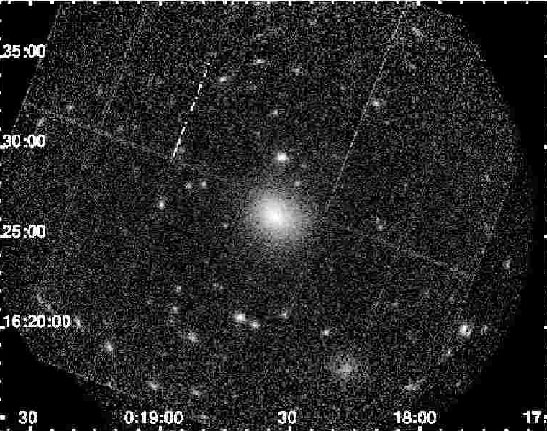 |
Figure 13. Combined MOS-1, MOS-2, and pn image of CL 0016+16 in 0.3 to 5.0 keV, corrected for vignetting but without background subtraction. Artefacts associated with the edges of the chips are evident. CL 0016+16 is the dominant central extended source. The associated quasar and one of the associated companion clusters lie just north and to the south-west, respectively, of CL 0016+16. |
 |
Figure 14. The 0.3 to 5.0 keV radial
profile of CL 0016+16 after
subtraction of local background. The curve shows the best-fit
circularly symmetric isothermal
|
A spectrum of CL 0016+16 extracted from the central part of the cluster is shown in Fig. 15. This spectrum can be well fitted by a single-temperature plasma, with kB Tgas = 9.1 ± 0.2 keV and an abundance of 0.22 ± 0.04 times the solar abundance. There are sufficient counts in this spectrum (32600 net counts from the three cameras in 0.3 - 10.0 keV) that the redshift of the emitting plasma can be determined, and shown to be consistent with the optically-derived redshift of the cluster. It should be noted that there remain uncertainties in the spectral extraction and fitting procedure because of the significant backgrounds in the X-ray images and the complicated distributions of background counts in energy and position on the cameras, and because of residual uncertainties in the calibration.
 |
Figure 15. The XMM spectrum of CL 0016+16 from a circle of radius 90 arcsec. The upper spectrum is derived from the pn data, while the lower is from the MOS-1 and MOS-2 data. The fit is to an isothermal gas with kBT = 9.1 keV, and abundance of 0.22 times the solar value, at the optical redshift of the cluster. |
A further issue is that of structural or thermal substructure in the
cluster. A close examination of the central part of the cluster's
X-ray image reveals a small central sub-structure that is also seen in
the Chandra data. The change in central brightness in the radial
profile Fig. 14 due to this central structure is
small, so the overall parameters of the
model
shouldn't be
affected by its presence, but there is some evidence that the central
structure is slightly (~ 0.5 keV) hotter than the bulk of the
cluster, although the significance is not high.
There are some other variations from the
model
profile: in
particular there is a region of low surface-brightness emission to the
SW of the cluster that is also seen in an earlier ROSAT image
(Neumann and Böhringer
1997),
but again these brightness structures are
too small to affect the overall structural fits.
With the aid of the gas temperature and abundance that are provided by the analysis of the X-ray spectrum, the detected counts can be converted into the central density of the gas in the cluster (conveniently characterised by the central proton density, np0) if some assumption is made about the cosmology. The derived np0 and kB Tgas are subject to systematic errors from background subtraction uncertainties in both the radial profile and the spectrum, and from our ignorance about small-scale temperature variations in the cluster.