


General Relativity tells us that any mass will cause a curvature of spacetime in its vicinity. Therefore, any mass located along the line of sight to a distant luminous object will act as a gravitational lens by deflecting light rays emanating from the object as they propagate through the universe. The most striking instances of gravitational lensing (e.g., multiple images, rings, arcs) are examples of rare phenomena caused by strong gravitational lenses, which greatly distort the images of distant galaxies. In contrast to this, weak gravitational lenses distort the images of distant galaxies very little but produce a net coherent pattern of image distortions in which there is a slight preference for the lensed galaxies to be oriented tangentially with respect to the direction vector that connects their centroids with the center of the gravitational potential of the lens. While weak lenses do not give rise to stunning individual images, they are detectable in a statistical sense via ensemble averages over many mildly-distorted images (e.g., [9], [10], [11], [12]).
Provided the distance traveled by the light ray is very much
greater than the scale size of the lens, it is valid to
adopt the "thin lens approximation" in order to describe
a gravitational lens. Consider a lens with an arbitrary
3-dimensional potential,
 . In the thin lens
approximation a conveniently scaled 2-dimensional potential for
the lens (i.e., the 3-dimensional potential of the lens integrated
along the optic axis) is given by
. In the thin lens
approximation a conveniently scaled 2-dimensional potential for
the lens (i.e., the 3-dimensional potential of the lens integrated
along the optic axis) is given by
 |
(2) |
where
 is the
location of the lensed image on the
sky, measured with respect to the optic axis, and Dls,
Dl, and
Ds are angular diameter distances
between the lens and source, observer and lens, and observer and
source, respectively (e.g.,
[8]).
It is then straightforward to relate the gravitational potential of the
lens to the two fundamental quantities that
characterize the lens: the convergence
(
is the
location of the lensed image on the
sky, measured with respect to the optic axis, and Dls,
Dl, and
Ds are angular diameter distances
between the lens and source, observer and lens, and observer and
source, respectively (e.g.,
[8]).
It is then straightforward to relate the gravitational potential of the
lens to the two fundamental quantities that
characterize the lens: the convergence
( ) and the shear
(
) and the shear
( ). The convergence, which
describes the isotropic focusing of light rays, is given by
). The convergence, which
describes the isotropic focusing of light rays, is given by
 |
(3) |
The shear describes tidal gravitational forces acting across
a bundle of light rays and, therefore, the shear has both a magnitude,
 =
(12 +
22)1/2,
and an orientation,
=
(12 +
22)1/2,
and an orientation,
 . In
terms of
. In
terms of  , the
components of the shear are given by
, the
components of the shear are given by
 |
(4) |
and
 |
(5) |
The effect of convergence and shear acting together in a gravitational
lens is to distort the images of distant objects. Consider
a source galaxy which is spherical in shape. In the absence of a
gravitational lens, an observer would see an image of the galaxy which
is truly circular. If a gravitational lens is interposed along the
line of sight to the distant galaxy,
the observer will see an image which, to first order,
is elliptical and the major axis
of the ellipse will be oriented tangentially with respect to the
direction vector on the sky that connects the centroids of the image
and the lens. That is, the circular source is distorted into an
ellipse, and to first order the distortion consists of both a
tangential stretch of
(1 - -
)-1 and a radial compression of
(1 - +
)-1 (e.g.,
[8]).
In the weak lensing regime, both the convergence and shear are
small ( < < 1
and <
< 1).
The fundamental premise in all attempts to detect weak lensing is that, in the absence of lensing, galaxy images have an intrinsically random ellipticity distribution. Gravitational lensing then introduces a shift in the ellipticity distribution that, in the mean, manifests as a tangential alignment of background sources around foreground lenses. The image of a distant galaxy can be approximated an ellipse with complex image ellipticity given by
 |
(6) |
where a and b are the major and minor axes, respectively,
and  is
the position angle. The complex image ellipticity is often referred to
as the "image polarization" (e.g.,
[39])
and is computed in terms of flux-weighted second moments,
is
the position angle. The complex image ellipticity is often referred to
as the "image polarization" (e.g.,
[39])
and is computed in terms of flux-weighted second moments,
 |
(7) |
where Ii, j is the intensity at a given pixel and Wi, j is a weighting function. The real and imaginary components of the image polarization are then given by:
 |
(8) |
The observed image polarization for any one source is, of course, a
combination of its intrinsic ellipticity and any ellipticity that is induced
by lensing. In the limit of weak lensing, the observed image polarization,
 obs, is
related to the intrinsic image polarization,
int
through a shift in the complex plane. Although we cannot determine
int for
any one particular source galaxy,
we have that the mean intrinsic ellipticity distribution for an
ensemble of source galaxies is
<int>
= 0 since
the galaxies should be randomly-oriented in the absence of lensing. An
estimator for the shear induced by weak lensing is then
=
<obs>
/ 2 (e.g.,
[39]).
This simple estimator does not reflect the fact that the way in which
the shear alters the shape of a source
depends upon its intrinsic ellipticity, and in practice this is generally
taken into account when computing the shear. See, e.g.,
[40],
[41],
and [42]
for discussions of the
"shear polarizability" and "shear responsivity" of sources. In addition, it
is worth noting that, while it is common practice to approximate image
shapes as ellipses, there will be some images that have been sufficiently
distorted by galaxy-galaxy lensing that a mild bending, or "flexion",
of the images will occur and such images cannot be accurately
represented as ellipses. In principle, flexion of images can
be used to detect weak lensing with a signal-to-noise that is increased
over the common practice of fitting equivalent image ellipses
[43],
[44].
A preliminary application of this technique
[43]
has been carried out with the Deep Lens
Survey [45],
and it will be interesting to see how the technique is further
developed and implemented in practice.
obs, is
related to the intrinsic image polarization,
int
through a shift in the complex plane. Although we cannot determine
int for
any one particular source galaxy,
we have that the mean intrinsic ellipticity distribution for an
ensemble of source galaxies is
<int>
= 0 since
the galaxies should be randomly-oriented in the absence of lensing. An
estimator for the shear induced by weak lensing is then
=
<obs>
/ 2 (e.g.,
[39]).
This simple estimator does not reflect the fact that the way in which
the shear alters the shape of a source
depends upon its intrinsic ellipticity, and in practice this is generally
taken into account when computing the shear. See, e.g.,
[40],
[41],
and [42]
for discussions of the
"shear polarizability" and "shear responsivity" of sources. In addition, it
is worth noting that, while it is common practice to approximate image
shapes as ellipses, there will be some images that have been sufficiently
distorted by galaxy-galaxy lensing that a mild bending, or "flexion",
of the images will occur and such images cannot be accurately
represented as ellipses. In principle, flexion of images can
be used to detect weak lensing with a signal-to-noise that is increased
over the common practice of fitting equivalent image ellipses
[43],
[44].
A preliminary application of this technique
[43]
has been carried out with the Deep Lens
Survey [45],
and it will be interesting to see how the technique is further
developed and implemented in practice.
The first attempts to detect systematic weak lensing of
background galaxies by foreground galaxies
([46],
[47])
were met with a certain degree of skepticism
because the apparent distortion of the source galaxy images
was rather smaller than one would expect based upon the typical
rotation velocities of the disks of large spiral galaxies. The situation
changed when Brainerd, Blandford & Smail
[13]
measured the orientations of 506 faint galaxies
(23 < rf
 24)
with respect to the locations of 439 bright
galaxies (20
rb
23) and found that the
orientation of the faint galaxies was inconsistent with a random
distribution at the 99.9% confidence level. The faint galaxies
showed a clear preference for tangential alignment with the
direction vector on the sky that connected the centroids of
the faint and bright galaxies, in agreement with the expectations
of systematic weak lensing of the faint galaxies by the bright galaxies.
24)
with respect to the locations of 439 bright
galaxies (20
rb
23) and found that the
orientation of the faint galaxies was inconsistent with a random
distribution at the 99.9% confidence level. The faint galaxies
showed a clear preference for tangential alignment with the
direction vector on the sky that connected the centroids of
the faint and bright galaxies, in agreement with the expectations
of systematic weak lensing of the faint galaxies by the bright galaxies.
Almost immediately, a number of similar investigations followed in the wake of Brainerd, Blandford & Smail [13], ([49], [50], [51], [52], [53], [54], [55]). These studies made use of a wide variety of data and analysis techniques, and all were broadly consistent with one another and with the results of Brainerd, Blandford & Smail [13] (see, e.g., the review by Brainerd & Blandford [14]). The first truly undeniable detection of galaxy-galaxy lensing was obtained by Fischer et al. [53] with 225 sq. deg. of early commissioning data from the SDSS, and it was this result in particular that helped to make the study of galaxy-galaxy lensing into a respectable endeavor, whereas previously many had considered the whole field rather dodgy at best. Fisher et al. [53] demonstrated conclusively that even in the limit of somewhat poor imaging quality, including the presence of an anisotropic point spread function due to drift scanning, galaxy-galaxy lensing can be detected with very high significance in wide-field imaging surveys. In the last few years, detections of galaxy-galaxy lensing and the use of the signal to constrain the dark matter halos of field galaxies has improved dramatically ([24], [42], [48], [56], [57], [58], [59], [60], [61]) owing to a number of factors that include such things as very large survey areas, sophisticated methods for correcting image shapes due to anisotropic and spatially-varying point spread functions, and the use of distance information for large numbers foreground lens galaxies in the form of either spectroscopic or photometric redshifts.
Figure 2 shows one
example of the high statistical significance with which weak lensing
due to galaxies is now being routinely detected. The
result comes from an analysis of the distortion of the images of
~ 1.5 × 10⁶ source galaxies due to
~ 1.2 × 10⁵ lens galaxies in the RCS
[48],
where the lens and source populations were
separated solely on the basis of their apparent magnitudes.
The top panel of Figure 2
shows the mean tangential shear computed about the lens centers
which, because of the clustering
of the lens galaxies, is not simply interpreted as the tangential
shear due to individual lens centers. Instead, it is a
projected (i.e., 2-dimensional) galaxy-mass
cross-correlation function, and in order to compute the average
properties of the halos of the lens galaxies it is necessary to, e.g.,
make use of Monte Carlo simulations that include all of the multiple
weak deflections that the sources have undergone. The bottom panel of
Figure 2 shows a control statistic in which the
tangential
shear about the lens centers is computed after rotating the images of
the sources by 45°. If the signal in the top panel of
Figure 2 is caused by gravitational lensing, the
control statistic in the bottom panel of Figure 2
should be consistent
with zero (and indeed it is). Note that, although the tangential shear
about the RCS lenses persists to scales of order 0.5°, the shear
on such large scales is not indicative of the masses of individual lens
galaxies; rather it reflects the intrinsic clustering of the lenses.
It is also worth noting that less than decade ago observers were struggling
to measure a tangential shear of
 0.01 with a
modest degree of confidence. Now,
however, confident detection of tangential shears of
0.0001 is
effectively "routine" in these extremely large data sets.
0.01 with a
modest degree of confidence. Now,
however, confident detection of tangential shears of
0.0001 is
effectively "routine" in these extremely large data sets.
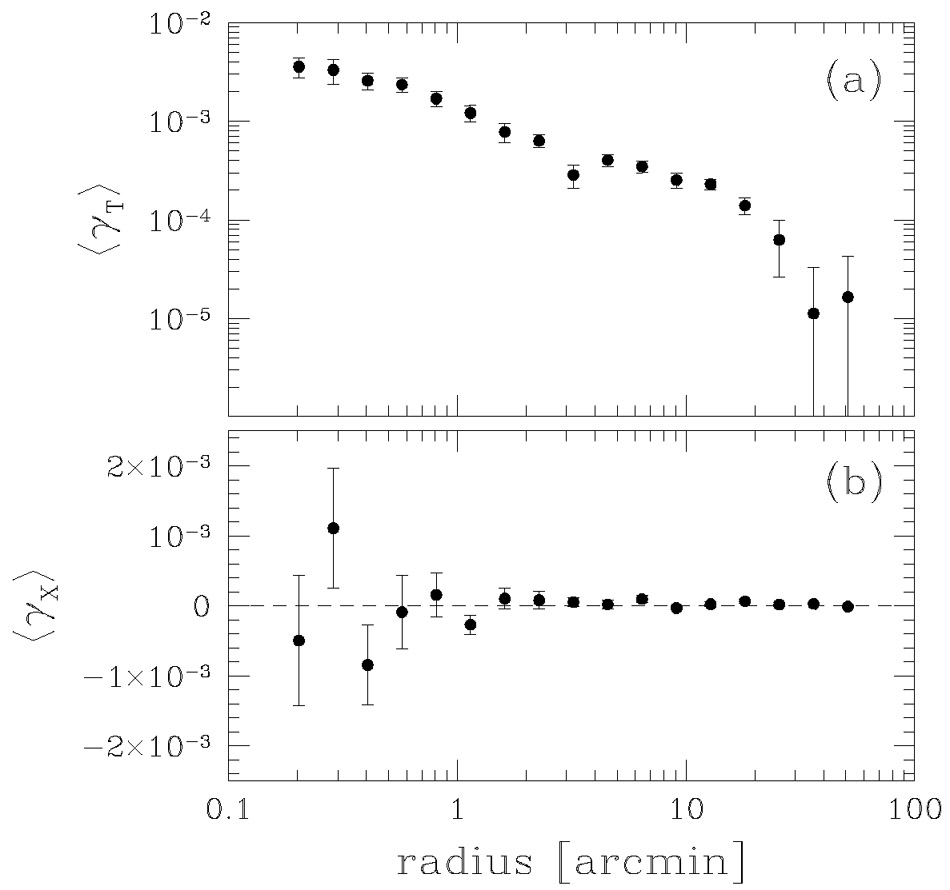 |
Figure 2. a) Mean tangential shear computed about the lens centers in ~ 42 sq. deg. of the RCS [48]. Here foreground galaxies and background galaxies have been separated on the basis of apparent magnitude alone. Bright, lens galaxies have 19.5 < RC < 21 and faint, source galaxies have 21.5 < RC < 24. b) Same as in a) except that here each background galaxy image has been rotated by 45°. This is a control statistic and in the absence of systematic errors it should be consistent with zero on all scales. Figure kindly provided by Henk Hoekstra. |
The mean tangential shear,
T(rp), in an annulus of
projected radius rp
is related to the projected surface mass density of the lens through
 |
(9) |
where
 (r
< rp)
is the mean surface mass density interior to the projected radius
rp,
(rp) is the projected surface
mass density at radius rp (e.g.,
[62],
[63],
[58]),
and
(r
< rp)
is the mean surface mass density interior to the projected radius
rp,
(rp) is the projected surface
mass density at radius rp (e.g.,
[62],
[63],
[58]),
and  c
is the so-called critical surface mass density:
c
is the so-called critical surface mass density:
 |
(10) |
where c is the velocity of light and
Ds, Dl, and Dls
are again angular diameter distances
[8].
The quantity  (rp)
above is, therefore, a mean excess projected mass
density. Shown in Figure 3 is the mean
excess projected surface mass density in physical units of h
M
(rp)
above is, therefore, a mean excess projected mass
density. Shown in Figure 3 is the mean
excess projected surface mass density in physical units of h
M pc-2 for ~ 1.27 × 10⁵ lens galaxies in the
SDSS for which spectroscopic redshifts are known
[42].
In addition to spectroscopic
redshifts for the lenses, photometric redshifts were used for
~ 9.0 × 10⁹ source galaxies. Moreover, because the redshifts
of the lens galaxies are known,
(rp)
can be computed as a function of the physical projected radius at the
redshift of the lens (rather than an angular scale). In
Figure 3,
(rp)
has been corrected for the clustering of the sources
around the lenses via a function which is effectively a weighted
cross-correlation function between the lenses and sources
[42].
pc-2 for ~ 1.27 × 10⁵ lens galaxies in the
SDSS for which spectroscopic redshifts are known
[42].
In addition to spectroscopic
redshifts for the lenses, photometric redshifts were used for
~ 9.0 × 10⁹ source galaxies. Moreover, because the redshifts
of the lens galaxies are known,
(rp)
can be computed as a function of the physical projected radius at the
redshift of the lens (rather than an angular scale). In
Figure 3,
(rp)
has been corrected for the clustering of the sources
around the lenses via a function which is effectively a weighted
cross-correlation function between the lenses and sources
[42].
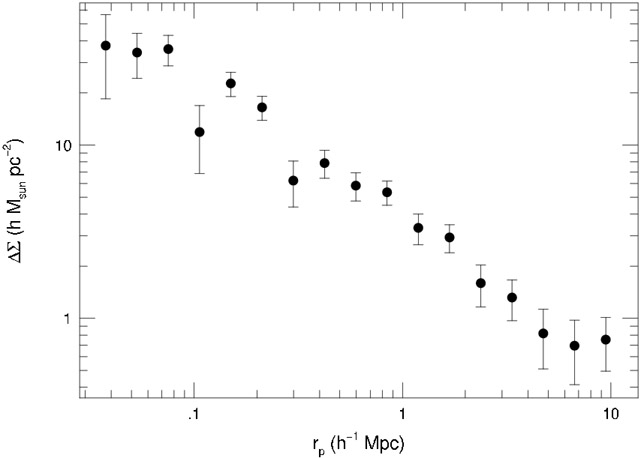 |
Figure 3. Mean excess projected mass
density around weak galaxy lenses in the
SDSS [42].
Here ~ 1.27 × 10⁵ lenses with spectroscopic
redshifts and ~ 9.0 × 10⁹ sources with photometric
redshifts have been used in the calculation. The values of
|
Having obtained a measurement of
T( ), or equivalently
(rp),
constraints can then be placed on the nature
of the dark matter halos of the lens galaxies by modeling the
observed signal. As mentioned earlier,
quite a bit of care has to be taken in doing this
if the goal is to constrain the halo parameters as
a function of, say, the host luminosity, color, or morphology (see, e.g.,
[16]).
In the past few years, however,
good constraints on the mass of an "average" halo associated
with an L* galaxy, as well as fundamental
differences between the halos of L*
ellipticals versus L* spirals, have
emerged from galaxy-galaxy lensing studies and it is those studies
which are summarized below.
), or equivalently
(rp),
constraints can then be placed on the nature
of the dark matter halos of the lens galaxies by modeling the
observed signal. As mentioned earlier,
quite a bit of care has to be taken in doing this
if the goal is to constrain the halo parameters as
a function of, say, the host luminosity, color, or morphology (see, e.g.,
[16]).
In the past few years, however,
good constraints on the mass of an "average" halo associated
with an L* galaxy, as well as fundamental
differences between the halos of L*
ellipticals versus L* spirals, have
emerged from galaxy-galaxy lensing studies and it is those studies
which are summarized below.