


Although it ought to be straightforward and even easy to compare
the halo masses and galaxy mass-to-light ratios that are obtained
from different studies, in practice it is rather like comparing
persimmons to tomatoes; i.e., they are vaguely similar on the inside
and outside, but they are definitely not interchangeable.
The fundamental problem is that it is simply not
possible to measure the "total" mass of a galaxy halo (since it
is not possible to say where such a halo "ends") and, hence, all
halo masses are simply masses that are contained within some
physical radius of the center of the halo. Along those same lines,
and given that velocity dispersion profiles of NFW halos decrease
with radius, if one wants to compare the results of two investigations
which have measured a velocity dispersion averaged over some large
scale, it is important that those scales be identical. That
is, suppose a single measurement of
 v is made by
averaging over scales
r < 100 h-1 kpc in one study and a single
measurement of
v is made by
averaging over scales r < 200 h-1 kpc
in another. If the second measurement of
v is lower than
the first by some significant amount, that does not necessarily mean
that the values are in disagreement. They would be in disagreement
if both halos were isothermal spheres, but if the halos
are NFW objects, then it is only to be expected that the second measurement
would be lower than the first.
v is made by
averaging over scales
r < 100 h-1 kpc in one study and a single
measurement of
v is made by
averaging over scales r < 200 h-1 kpc
in another. If the second measurement of
v is lower than
the first by some significant amount, that does not necessarily mean
that the values are in disagreement. They would be in disagreement
if both halos were isothermal spheres, but if the halos
are NFW objects, then it is only to be expected that the second measurement
would be lower than the first.
A more subtle problem is the definition of the "virial radius" in the context of NFW halos. While r200 was originally proposed as the radius at which the interior mass density is 200 times the critical mass density (e.g., [5], [6], [7]), it is not at all uncommon to find that investigators who have fit NFW models to their data have defined the virial radius as the radius at which the interior mass density is 200 times the mean mass density of the universe. Therefore, what is meant by a "virial mass" in the context of an NFW fit to data can (and does) vary from investigation to investigation, and a certain amount of care has to be taken when comparing such results. Despite the difficulties of comparing the conclusions of different studies, I will forge ahead because it is becoming clear that a consistent picture really is emerging on the topic of the masses of the halos of field galaxies, and their corresponding mass-to-light ratios. The weak lensing studies yield results that are by and large consistent with each other, and the dynamical studies seem to be in general agreement with the trends in the weak lensing data: the halos have masses that are consistent with expectations for galaxy-sized halos in CDM, and there are real, physical differences between halos surrounding (i) early-type and late-type galaxies and (ii) high-luminosity and low-luminosity galaxies.
7.1. M and M / L from Galaxy-Galaxy Lensing
In the case of galaxy-galaxy lensing, it is not possible at the moment
to discriminate between shear profiles that are caused by NFW versus
isothermal galaxy halos. Therefore, investigators will often choose one or
the other to constrain the properties of the halos that are producing
the lensing signal. In the case of isothermal sphere halos, the
velocity dispersions of the lens galaxies used to model the observed
signal are often chosen to scale as in eqn. (19) above,
(v /
v*) = (L /
L*) ,
where again v
is the velocity dispersion of a halo that contains
a galaxy of luminosity L, and v* is the velocity dispersion
of the halo of
an L* galaxy. Hoekstra et al.
[48] used this
approach with their RCS data, as did Kleinheinrich et al.
[60]
with their COMBO-17 data. When all lenses and
sources were used in the investigations, and when the lensing signal
was averaged over an identical scale (r
,
where again v
is the velocity dispersion of a halo that contains
a galaxy of luminosity L, and v* is the velocity dispersion
of the halo of
an L* galaxy. Hoekstra et al.
[48] used this
approach with their RCS data, as did Kleinheinrich et al.
[60]
with their COMBO-17 data. When all lenses and
sources were used in the investigations, and when the lensing signal
was averaged over an identical scale (r
 350
h-1 kpc), both the RCS and COMBO-17 results
are in very good agreement with each other. In particular, Hoekstra et al.
[48]
find v* = 136 ± 8 km
sec-1 for an adopted value of
= 0.3, and
Kleinheinrich et al.
[60]
find v* =
138+18-24 and
=
0.34+0.18-0.12. Further, Kleinheinrich et al.
[60] find
that there are clear differences in the halos surrounding "blue"
galaxies (rest frame colors of
(U - V)
350
h-1 kpc), both the RCS and COMBO-17 results
are in very good agreement with each other. In particular, Hoekstra et al.
[48]
find v* = 136 ± 8 km
sec-1 for an adopted value of
= 0.3, and
Kleinheinrich et al.
[60]
find v* =
138+18-24 and
=
0.34+0.18-0.12. Further, Kleinheinrich et al.
[60] find
that there are clear differences in the halos surrounding "blue"
galaxies (rest frame colors of
(U - V)  1.15 - 0.31z - 0.08[MV -5 log h + 20])
and those surrounding "red" galaxies (the remainder
of the sample). That is, the red COMBO-17 lens galaxies have a higher
velocity dispersion than the blue COMBO-17 lens
galaxies, but both have a similar value of
the index
above. See Figure 8.
1.15 - 0.31z - 0.08[MV -5 log h + 20])
and those surrounding "red" galaxies (the remainder
of the sample). That is, the red COMBO-17 lens galaxies have a higher
velocity dispersion than the blue COMBO-17 lens
galaxies, but both have a similar value of
the index
above. See Figure 8.
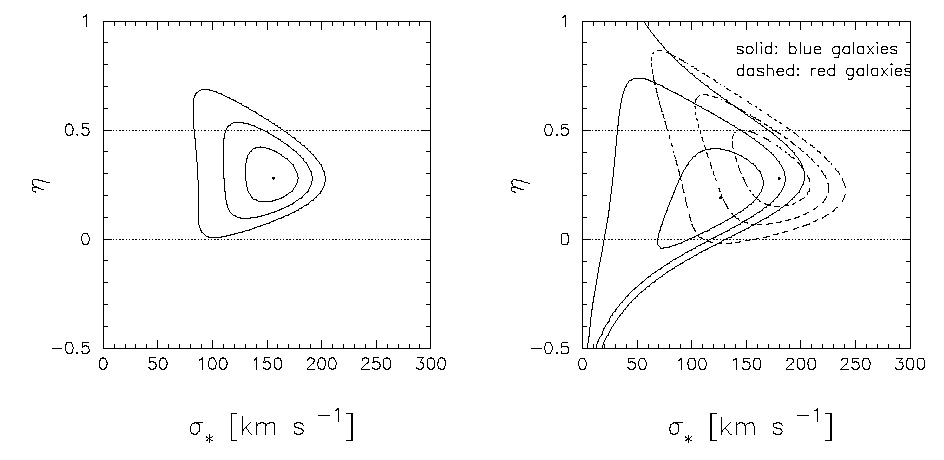 |
Figure 8. Isothermal sphere models for the
galaxy-galaxy data from COMBO-17
[60].
Joint constraints
(1 |
In addition, Guzik & Seljak
[16],
Hoekstra et al.
[48],
and Kleinheinrich et al.
[60]
have all used NFW halos to model their lens galaxies, and all find very
reasonable fits to their lensing signals. Further, the derived values
of the NFW virial masses of the halos of L*
galaxies are in quite
good agreement amongst these studies when they are determined in
similar band passes (e.g., r) and with identical definitions of
the virial radius
[60]:
Mvir* = 8.96 ± 1.59 ×
1011 h-1
M [16],
Mvir* = 8.4 ± 0.7 ×
1011 h-1
M
[48], and
Mvir* =
7.8+3.5-2.7 × 10¹¹
h-1
M
[60].
These are also in remarkably good agreement with the virial mass implied
for the halos of L* galaxies by the dynamical
analysis of Prada et al.
[27]
(e.g., Mvir* ~ 10 ×
1011 h-1
M).
Shown in Figure 9
are 1,
2 and
3 confidence limits on a
joint-parameter fit of the circular velocity at r200,
V200, and scale radius,
rs, for the lenses in the RCS data
[48].
Note that in the analysis of the RCS data, V200 and
rs were allowed to vary freely, while, to within some
scatter, these parameters are strongly correlated in the NFW
theory (i.e., the NFW model is in essence specified by a single
parameter). The dashed line in Figure 9
therefore shows the
prediction for a strict adherence to the NFW theory (i.e.,
V200 and rs are correlated
appropriately), and the fact that
the theoretical NFW line passes so well through the contours gives
a certain amount of confidence that the NFW model is a very good fit
to the data. Kleinheinrich et al.
[60]
find good fits of the NFW model to their data and, moreover, find that
both the virial radii of the halos and the parameter
are
dependent upon the rest frame colors of the galaxies, with red galaxies
having a somewhat larger virial radius (and, hence, larger virial
mass) than blue galaxies. See Figure 10.
Here is
defined not as in eqn. (19), since the velocity dispersion is a function
of projected radius in the NFW model, but rather it is defined as:
[16],
Mvir* = 8.4 ± 0.7 ×
1011 h-1
M
[48], and
Mvir* =
7.8+3.5-2.7 × 10¹¹
h-1
M
[60].
These are also in remarkably good agreement with the virial mass implied
for the halos of L* galaxies by the dynamical
analysis of Prada et al.
[27]
(e.g., Mvir* ~ 10 ×
1011 h-1
M).
Shown in Figure 9
are 1,
2 and
3 confidence limits on a
joint-parameter fit of the circular velocity at r200,
V200, and scale radius,
rs, for the lenses in the RCS data
[48].
Note that in the analysis of the RCS data, V200 and
rs were allowed to vary freely, while, to within some
scatter, these parameters are strongly correlated in the NFW
theory (i.e., the NFW model is in essence specified by a single
parameter). The dashed line in Figure 9
therefore shows the
prediction for a strict adherence to the NFW theory (i.e.,
V200 and rs are correlated
appropriately), and the fact that
the theoretical NFW line passes so well through the contours gives
a certain amount of confidence that the NFW model is a very good fit
to the data. Kleinheinrich et al.
[60]
find good fits of the NFW model to their data and, moreover, find that
both the virial radii of the halos and the parameter
are
dependent upon the rest frame colors of the galaxies, with red galaxies
having a somewhat larger virial radius (and, hence, larger virial
mass) than blue galaxies. See Figure 10.
Here is
defined not as in eqn. (19), since the velocity dispersion is a function
of projected radius in the NFW model, but rather it is defined as:
 |
(20) |
in analogy to the Tully-Fisher and Faber-Jackson relations (see
[60]).
In this case,
rvir* is the virial radius of the
halo of an L* galaxy, defined at 200 times
the mean mass density of the universe. The variation of
with galaxy
color and its implications for the mass-to-light
ratios of the galaxies will be discussed below.
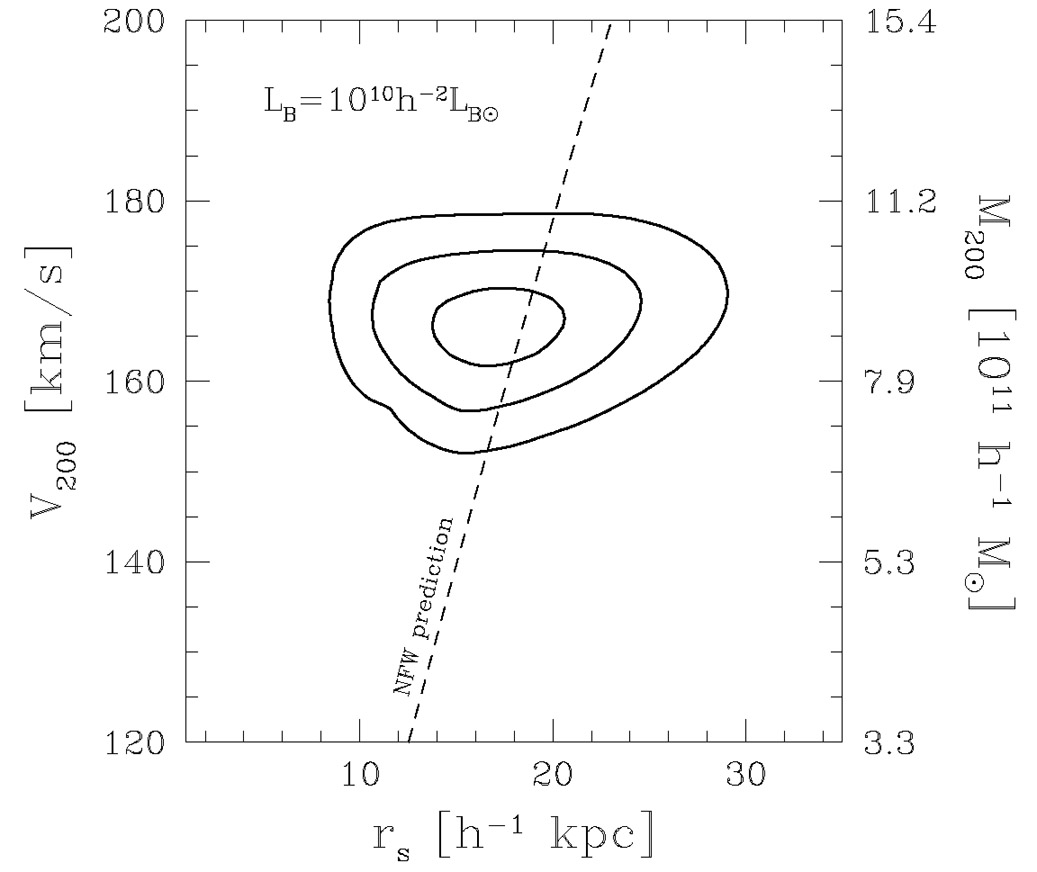 |
Figure 9. Constraints on the circular
velocity at r = r200 and the scale
radius, rs, for lenses in the RCS that have been
modeled as having NFW-type halos
[48].
Formally, the best-fitting
values of the circular velocity, scale radius and virial mass are:
V200 = 162 ± 8 km sec-1,
rs = 16.2+3.6-2.9
h-1 kpc, and
M200 = 8.4 ± 1.1 × 10¹¹
h-1
M |
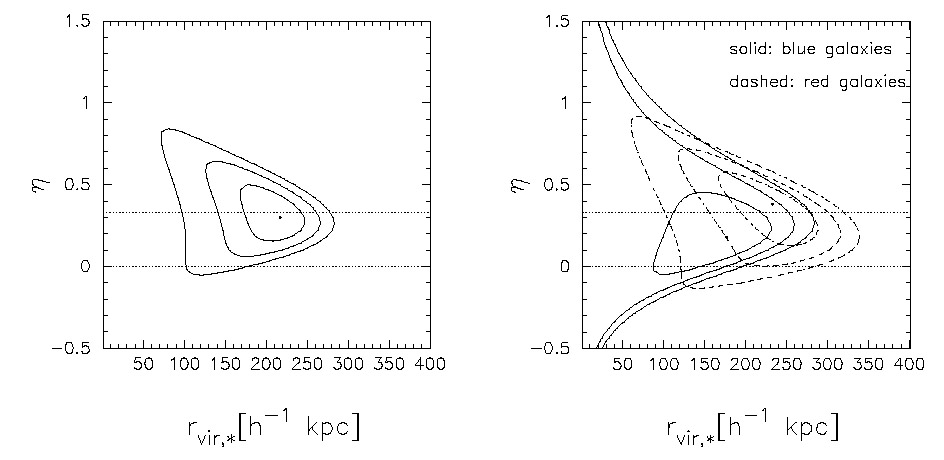 |
Figure 10. NFW halo models of the
galaxy-galaxy lensing data from COMBO-17
[60].
Joint constraints (1 |
A particularly detailed study of the masses of lensing galaxies as a function of their color was carried out by Guzik & Seljak [16] for ~ 3.5 × 10⁴ lenses and ~ 3.6 × 10⁶ sources in the SDSS. All of the lens galaxies have spectroscopic redshifts in this case, and all of the halos were modeled as NFW objects in the context of the "halo model". In all 5 of the SDSS band passes, Guzik & Seljak [16] find that the virial masses of L* ellipticals exceed those of L* spirals though, unsurprisingly, the amount by which the masses of the ellipticals exceeds those of the spirals is a strong function of the band pass. In the redder bands, the masses of the ellipticals exceed those of the spirals by a factor of ~ 2 to ~ 2.5, while in g' the difference is a factor of ~ 6 and in u' the difference is close to an order of magnitude. Although it is difficult to make direct comparisons between the two studies (because of the differing definitions of the virial radius and the different definitions of the subsamples of galaxies), there is good general agreement between the results of Guzik & Seljak [16] and Kleinheinrich et al. [60]: when the galaxy-galaxy lensing signal is detected red band passes (e.g., R, r') and the lenses are modeled as NFW objects, the virial masses of red/early-type galaxies exceed those of blue/late-type galaxies by a factor of order 2.
In addition to the halos of early-type lenses having more mass
than those of late-type lenses, the weak lensing
work of Sheldon et al.
[42]
indicates that, again, in all 5 SDSS band passes, the projected excess
surface mass density increases with the luminosity of the lens.
Sheldon et al.
[42]
separated their ~ 1.27 × 10⁵ lenses
into 3 magnitude bins (high, middle, and low luminosity), and the
magnitude cuts differ for the different band passes. (See Table 2 of
Sheldon et al.
[42]
for a complete list of the magnitude
cuts as a function of band pass.) In the case of the r' data, the
"high" luminosity galaxies have a mean absolute magnitude of -22.5,
the "middle" luminosity galaxies have a mean absolute magnitude
of -21.9, and the "low" luminosity galaxies have a mean absolute
magnitude of -20.5. These mean luminosities correspond roughly to
4.5L* ("high"),
2.7L* ("middle") and
0.8L* ("low") in the r' band.
In all cases, 
 (rp)
for the "high" luminosity galaxies
exceeds that of the "medium" and "low" luminosity galaxies, and for
rp
1
h-1 Mpc, the difference corresponds to an approximately
constant multiplicative factor. Specifically at
rp ~ 100 h-1 Mpc,
however,
for the high
luminosity lenses in Sheldon et al.
[42]
exceeds that for the low luminosity lenses by
a factors of ~ 3 in u', ~ 5 in g', ~ 5 in r',
~ 7 in i', and ~ 7 in z' (e.g., Figure 14 of Sheldon et al.
[42]).
Similar trends (i.e., higher projected excess
surface mass density for more luminous lenses) were found by Seljak et al.
[61]
in their galaxy-galaxy lensing analysis of SDSS data.
(rp)
for the "high" luminosity galaxies
exceeds that of the "medium" and "low" luminosity galaxies, and for
rp
1
h-1 Mpc, the difference corresponds to an approximately
constant multiplicative factor. Specifically at
rp ~ 100 h-1 Mpc,
however,
for the high
luminosity lenses in Sheldon et al.
[42]
exceeds that for the low luminosity lenses by
a factors of ~ 3 in u', ~ 5 in g', ~ 5 in r',
~ 7 in i', and ~ 7 in z' (e.g., Figure 14 of Sheldon et al.
[42]).
Similar trends (i.e., higher projected excess
surface mass density for more luminous lenses) were found by Seljak et al.
[61]
in their galaxy-galaxy lensing analysis of SDSS data.
Lastly, although there is reasonable agreement regarding the relative
increase in mass for the halos of early-type lens galaxies versus
late-type lens galaxies at fixed luminosity (i.e.,
L*), there
is some disagreement over the dependence of the mass-to-light ratio
on the luminosity of the host. Specifically, in their redder bands
Guzik & Seljak
[16]
find that the mass-to-light ratio goes as
M / L  L0.4±0.2 for
L > L*, suggestive
of a mass-to-light ratio that increases with luminosity. Kleinheinrich
et al.
[60],
however, find that M / L for their sample
of lenses is more consistent with a constant value:
M / L
L-0.10+0.48-0.36. Both Guzik
& Seljak
[16]
and Kleinheinrich et al.
[60]
agree, however, that the mass-to-light ratio of red/early-type
L* lens galaxies
exceeds that of blue/late-type L* lens
galaxies by a factor of ~ 2 to ~ 2.5 in the redder bands.
L0.4±0.2 for
L > L*, suggestive
of a mass-to-light ratio that increases with luminosity. Kleinheinrich
et al.
[60],
however, find that M / L for their sample
of lenses is more consistent with a constant value:
M / L
L-0.10+0.48-0.36. Both Guzik
& Seljak
[16]
and Kleinheinrich et al.
[60]
agree, however, that the mass-to-light ratio of red/early-type
L* lens galaxies
exceeds that of blue/late-type L* lens
galaxies by a factor of ~ 2 to ~ 2.5 in the redder bands.
7.2. M and M / L from Satellite Dynamics
In the 1990's, Zaritsky et al.
[20] and
Zaritsky & White
[98]
used the velocity differences between a
small number of isolated spiral galaxies and their satellites to show
that the halos of the spirals were massive and extended to large radii:
M(150 h-1 kpc) ~ 1 to
2 × 10¹²h-1
M.
Moreover, Zaritsky et al.
[20]
found a somewhat curious result:
the velocity difference between their 115 satellites and 69 hosts was
independent of the inclination corrected H-I line width of the host and
was, therefore, independent of the luminosity of the host (through, e.g.,
the Tully-Fisher relation). At fixed large radius, then, this would
imply that M / L for the spiral hosts decreased as
M / L
L-1.
More recent investigations of halo masses and corresponding mass-to-light ratios from satellite dynamics have led to rather a large assortment of conclusions. McKay et al. [65] and Brainerd & Specian [66] used the dynamics of the satellites of SDSS galaxies and 2dFGRS galaxies, respectively, to constrain the dynamical masses of the halos of the host galaxies interior to a radius of r = 260 h-1 kpc. Both used an isothermal mass estimator of the form
 |
(21) |
where v is
the line-of-sight velocity dispersion. Both felt
this assumption was justified because both found that their velocity
dispersion profiles were consistent with a constant value. In the case
of McKay et al.
[65],
however, no correction for an
increasing number of interlopers with projected radius was made and this
may have led to an incorrect conclusion that
v(rp) was independent
of rp. In the case of Brainerd & Specian
[66],
the increasing number of interlopers at large rp was
taken into account, but only
galaxies from the 100k data release of the 2dFGRS were used (i.e., roughly
half as many galaxies as in the full data release), and although
v(rp) was consistent with a
constant value in their data, the later analysis by Brainerd
[67]
showed that this was
simply due to the rather large error bars in Brainerd & Specian
[66].
This being the case, the mass-to-light ratios published
by these two studies are suspect at some level, but it is unclear at
the moment just how suspect they may actually be. That is, while it is
true that the velocity dispersion profile of NFW halos decreases with
radius, the fall-off in v(rp)
is not particularly sharp and it is not obvious
how badly isothermal mass estimates of the form in
eqn. (21), which are based on an average value of
v, will
compare to proper NFW mass estimates.
Formally, McKay et al.
[65]
found that in all 5 SDSS band passes,
M260dyn / L was roughly constant for
L > L*, and that the value of
M260dyn / L was a strong function of
the band pass (being systematically higher in the blue bands than in
the red bands). Brainerd & Specian
[66]
found that for
L  2L*,
M260dyn / L was a constant for dynamical
analyses that included (i) all 809 hosts in their sample and (ii) 159 hosts
that had been visually classified as early-type (E/S0). However, much
like the results of Zartisky et al.
[20],
Brainerd & Specian
[66]
found that M260dyn / L
decreased as M260dyn / L
L-1
for 243 hosts that had been
visually classified as spirals. This latter result remains puzzling,
and is certainly in need of further investigation with larger data sets.
2L*,
M260dyn / L was a constant for dynamical
analyses that included (i) all 809 hosts in their sample and (ii) 159 hosts
that had been visually classified as early-type (E/S0). However, much
like the results of Zartisky et al.
[20],
Brainerd & Specian
[66]
found that M260dyn / L
decreased as M260dyn / L
L-1
for 243 hosts that had been
visually classified as spirals. This latter result remains puzzling,
and is certainly in need of further investigation with larger data sets.
In their analysis of the dynamics of the satellites of SDSS host
galaxies, Prada et al.
[27]
found that the velocity dispersion of the satellites scaled with host
luminosity as
v
L0.3 (i.e., in good agreement with the local
B-band Tully-Fisher relationship
[99])
for satellites with projected radii rp < 120
kpc. (Recall, too, that in this study
v(rp) was specifically
corrected for the increase in
interlopers at large rp.) In addition, Prada et al.
[27]
found that for satellites at large projected radius,
250 kpc < rp < 350 kpc, the velocity dispersion
scaled with luminosity
as v
L0.5 (i.e., steeper than expected from the
Tully-Fisher relation). See Figure 11.
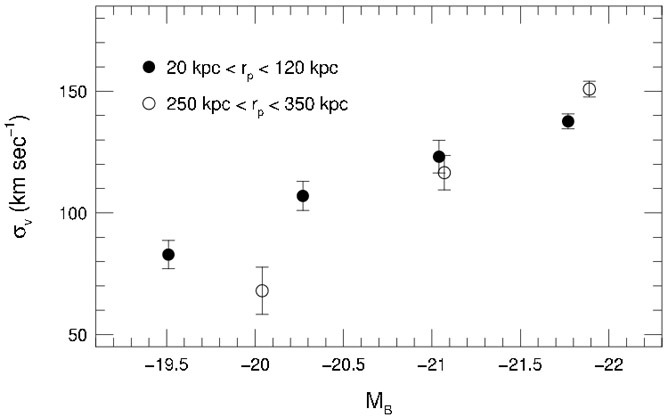 |
Figure 11. Dependence of satellite velocity
dispersion on host absolute magnitude for SDSS galaxies
[27].
Filled circles:
|
Similar to Prada et al.
[27],
Brainerd
[67]
also computed the dependence of the small-scale velocity dispersion
of satellites on host luminosity. See
Figure 12. Like Prada et al.
[27],
Brainerd
[67]
corrected for the fact that
the interloper fraction is an increasing function of projected radius and
overall, she found excellent agreement
between the velocity dispersions of satellites with projected radii
rp 120
kpc in the 2dFGRS and
GIF simulations. The velocity dispersions of the 2dFGRS satellites
were, however, seen to scale with host luminosity as
v
LbJ0.45±0.10, which is only
marginally consistent with the results of Prada et al.
[27]
and the local B-band Tully-Fisher relationship.
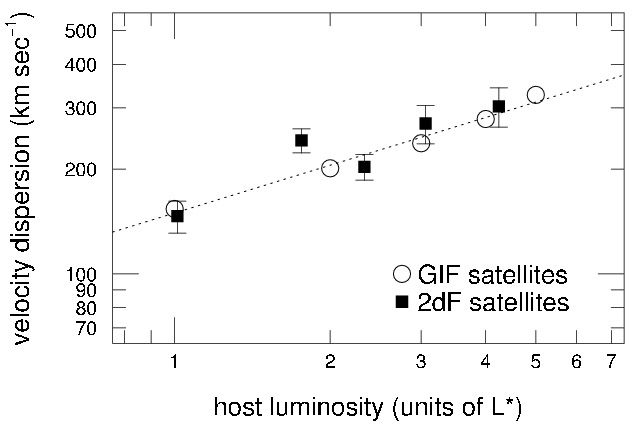 |
Figure 12. Dependence of satellite velocity
dispersion on host luminosity for satellites with projected radii
rp |
Prada et al.
[27]
have shown (e.g., their Figure 12) that the dependence
of the line of sight velocity dispersion on the virial
mass of NFW halos scales as
v
Mvir0.38 for the case that
v is
computed as an average over scales
20 kpc
rp
100 kpc, and that
v
Mvir0.50 for the case that
v is computed
at rp ~ 350 kpc. Combining this with their
results for the dependence of
v on L
at different scales leads to the conclusion that on scales
rp
120 kpc,
Mvir / L
L-0.2 while on scales
rp ~ 300 kpc,
Mvir / L is a constant. Similarly, if the halos
of the 2dFGRS galaxies studied by Brainerd
[67]
are assumed to be NFW objects, the implication is that
Mvir / L
L0.2+0.3-0.1
for the 2dFGRS hosts (again, computed on scales
rp
120 kpc).
While it certainly cannot be said that there is a consensus from weak
lensing and satellite dynamics
as to the exact dependence of the galaxy mass-to-light ratio
on L, it does seem to be the
case that all of these studies point towards a dependence of
Mvir / L
on L that is, at most, rather weak. That is, with the notable
exception of the Brainerd & Specian
[66]
result for late-type galaxies,
all of the recent determinations of M / L for
L
L* find that,
to within 2,
M/L is independent of L.
In addition, when the weak lenses and host galaxies are each
modeled as NFW objects, a fairly consistent value of the average
virial mass of the halos of L* galaxies is
found: ~ (8 - 10) × 1011 h-1
M.
Further, it seems to be clear that
both weak lensing and satellite dynamics indicate that the
masses of the halos of early-type galaxies are larger than that of
late-type galaxies, and that at fixed luminosity
the mass-to-light ratios of early-type galaxies are larger than
those of late-type galaxies.
 c.
The dashed line shows the predictions of the NFW theory, in which
V200 and r200 are not independent
parameters. Figure kindly provided by Henk Hoekstra.
c.
The dashed line shows the predictions of the NFW theory, in which
V200 and r200 are not independent
parameters. Figure kindly provided by Henk Hoekstra. -dominated GIF
simulation
[
-dominated GIF
simulation
[