

For almost 30 years the Schechter luminosity function (LF;
Schechter 1976)
has been the standard tool for quantifying the
galaxy population 1. The LF is
loosely based on the Press-Schechter formalisation for the primordial
halo distribution
(Press & Schechter
1974).
Moreover the LF consistently provides
a good formal fit to the observed luminosity distribution (LD; see for
example Norberg et
al. 2002).
This consistency, between the LD and LF,
appears to hold regardless of environment
(De Propris et
al. 2003;
Driver & De
Propris 2003).
The only departure from a pure Schechter function
appears to be in the central cores of rich clusters, where the galaxy
LD is often seen to show a marked upturn at the giant-dwarf boundary
(MB  - 16 mag). Perhaps the most well known example is the
central LD of the Coma cluster (e.g.,
Trentham 1998;
Beijersbergen et
al. 2002;
Andreon &
Culliandre 2002
and references therein). The
most plausible explanation is that the core contains an overdensity of
giant and dwarf ellipticals bolstering both the bright and faint-end
of the core cluster LF. For example the more extensive Coma survey by
Mobasher et al. 2004
recovers a flat and invariant LD/LF
(
- 16 mag). Perhaps the most well known example is the
central LD of the Coma cluster (e.g.,
Trentham 1998;
Beijersbergen et
al. 2002;
Andreon &
Culliandre 2002
and references therein). The
most plausible explanation is that the core contains an overdensity of
giant and dwarf ellipticals bolstering both the bright and faint-end
of the core cluster LF. For example the more extensive Coma survey by
Mobasher et al. 2004
recovers a flat and invariant LD/LF
( = - 1)
to MB
- 14 mag. The phenomena of an upturn in the LD, has
also been seen in Virgo
(Impey &
Bothun1988;
Trentham &
Hodgkin 2002),
A963
(Driver et al. 1994),
A868
(Driver et
al. 2003),
A2554
(Smith et
al. 1997) and
A2218
(Pracey et
al. 2004)
for example. However, apart from these
"active" core environments, the overall LDs from the field, to the
local group, to the local sphere, and near & far rich clusters all
consistently follow a smooth LF within the luminosity ranges
probed. Fig. 1 shows an (incomplete) summary of
b, B, V or g-band field and cluster LFs
colour corrected to the Johnson B filter.
= - 1)
to MB
- 14 mag. The phenomena of an upturn in the LD, has
also been seen in Virgo
(Impey &
Bothun1988;
Trentham &
Hodgkin 2002),
A963
(Driver et al. 1994),
A868
(Driver et
al. 2003),
A2554
(Smith et
al. 1997) and
A2218
(Pracey et
al. 2004)
for example. However, apart from these
"active" core environments, the overall LDs from the field, to the
local group, to the local sphere, and near & far rich clusters all
consistently follow a smooth LF within the luminosity ranges
probed. Fig. 1 shows an (incomplete) summary of
b, B, V or g-band field and cluster LFs
colour corrected to the Johnson B filter.
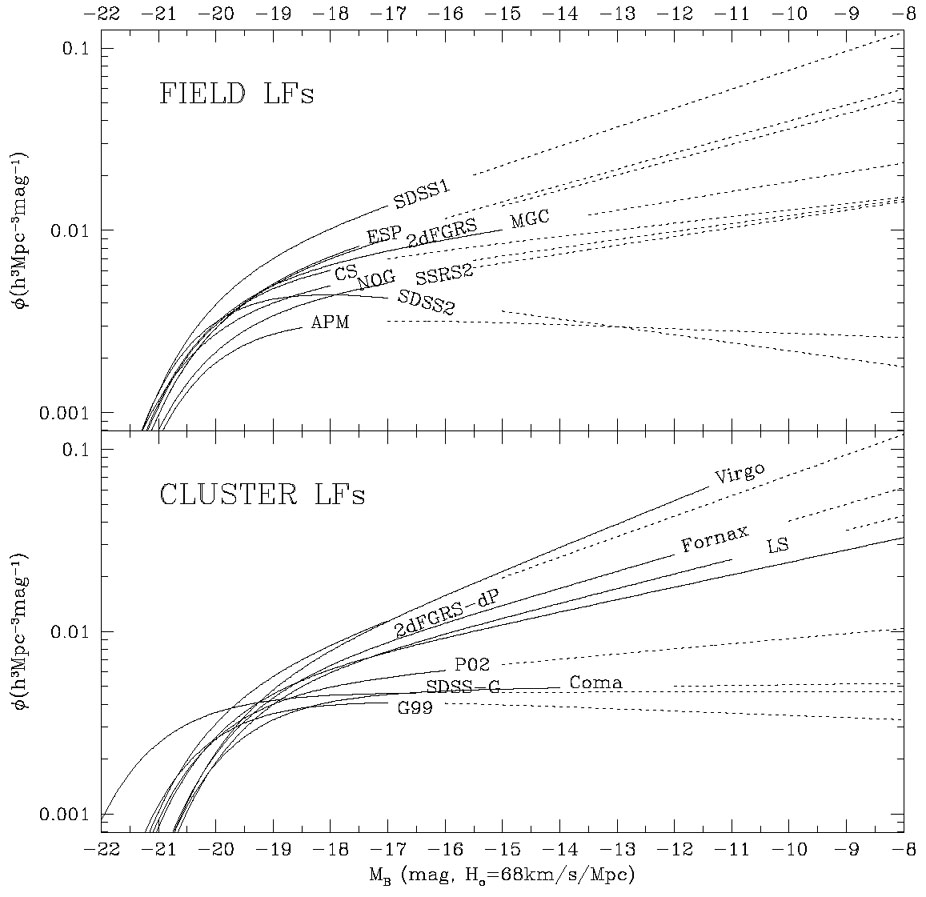 |
Figure 1. Various luminosity functions as
measured for the global
environment (upper) and cluster environment (lower). Data are taken
from Table. 3 of
Liske et al. (2003),
Table. 1 of
Driver & De Propris
(2003),
Table. 2 & 3 from
Blanton et
al. (2003)
and Table. 2 from
Driver et
al. (2004).
The solid lines show the regions over which the
luminosity functions have been fitted and the dotted lines the
extrapolations. The cluster luminosity functions have all been
arbitrarily normalised to
|
The main point to take from Fig. 1 is that the global and cluster LFs each show a broad but overlapping range of distributions. Clearly one cannot reasonably argue for any significant variation between the global and overall cluster environment on the basis of these data. Studies based within the same survey data, for example the two-degree field galaxy redshift survey study by Croton et al. 200u, generally find fairly subtle changes with environment. Hence it seems that the variations seen in Fig. 1 indicates an unspecified systematic error in the various studies. The most lauded of these is the unsavoury topic of surface brightness selection effects (Disney 1976, Impey & Bothun 1997). The concern is that the galaxy population at each luminosity interval occupies a range in surface brightness (or size). Surveys with shallow detection isophotes may miss both light from a galaxy's halo, as well as entire galaxies (see for example Sprayberry et al. 1997 and Dalcanton 1998). Cross & Driver 2002 explored this possibility in detail and demonstrated that indeed surface brightness selection effects can play havoc with the recovered Schechter function parameters and reproduce exactly the kind of variation seen in both the global and cluster LFs of Fig. 1.
More recently a number of papers have identified a clear luminosity-surface brightness (or size) 2 relation for field galaxies based on diverse datasets including: the Hubble Deep Field Driver 1999; the two-degree Field Galaxy Redshift Survey Cross et al. 2001; the Sloan Digital Sky Survey (Blanton et al. 2001; Shen et al. 2003); and a very local inclination and dust corrected sample of late-type disks de Jong & Lacey 2000. These studies consistently show that low surface brightness is synonymous with low luminosity - with a few notable exceptions as typified by Malin 1 Bothun et al. 1988 and the faint second disk surrounding NGC5084.
To fully resolve the potential impact of surface brightness selection effects one must consider the joint luminosity-surface brightness distribution. This has been advocated in the past, not so much to compensate for selection bias, but to preserve the size (or surface brightness) information which may be of interest in its own right (see Choloniewski 1985 and Sodré & Lahav 1993 for instance). This latter point is illustrated in Plate 1, where I show an example LF for a nearby volume limited sample and images of the actual galaxies contributing to the LF. Clearly much information is lost when one replaces these images with three simple numbers. It is for these reasons -- the need to accommodate selection bias and the desire to explore additional parameter space - coupled with the abundance of data that now moves us beyond the simple LD/LF to start exploring multivariate distributions. Here I introduce two such distributions, the luminosity-surface brightness plane (for the reasons stated above) and the colour-luminosity plane which is also of topical interest (e.g., Baldry et al. 2003; Hogg et al. 2004 and references therein).
 |
Plate 1. The global Galaxy Luminosity
Function (red line) condenses
the available information of galaxies (images) into three crucial
numbers: the characteristc luminosity (M*);
the absolute normalisation
( |
1 The Schechter function:
d ( ) =
*(L /
L*)
e(-L /
L*)d (L /
L*) has three key parameters,
L*
the characteristic luminosity where the exponential cutoff cuts in,
*, the normalisation at this
characteristic luminosity, and
, the faint-end slope
parameter. A value of
= - 1
implies equal numbers of galaxies in magnitude intervals, a more
negative (or steep) value implies numerous dwarf systems.
Back.
) =
*(L /
L*)
e(-L /
L*)d (L /
L*) has three key parameters,
L*
the characteristic luminosity where the exponential cutoff cuts in,
*, the normalisation at this
characteristic luminosity, and
, the faint-end slope
parameter. A value of
= - 1
implies equal numbers of galaxies in magnitude intervals, a more
negative (or steep) value implies numerous dwarf systems.
Back.
2 Luminosity, size and
surface brightness are related by
µeHLR = M + 2.5 log10
[2 RHLR2] + 36.57 where
µe is the effective surface brightness, M
the absolute magnitude, and
RHLR the semi-major axis half-light
radius in kpc, hence the luminosity-surface brightness relation can be
readily transformed to a luminosity-size distribution and we use the
acronym LSP to indicate either.
Back.
RHLR2] + 36.57 where
µe is the effective surface brightness, M
the absolute magnitude, and
RHLR the semi-major axis half-light
radius in kpc, hence the luminosity-surface brightness relation can be
readily transformed to a luminosity-size distribution and we use the
acronym LSP to indicate either.
Back.