


The simplest model for a cluster magnetic field is a uniform field through the whole cluster. However, this is not realistic: if the field values detected at the cluster centers would extend over several core radii, up to distances of the order of ~ Mpc, the magnetic pressure would exceed the thermal pressure in the outer parts of the clusters.
Jaffe [159] first suggested that the magnetic field distribution in a cluster would depend on the thermal gas density and on the distribution of massive galaxies and therefore would decline with the cluster radius. Constraints to the radial gradient of the cluster magnetic field strength are provided by observations of clusters hosting a radio halo. Indeed, the spatial correlation found in some clusters between the X-ray cluster brightness and the radio halo brightness [70] implies that the energy densities in the thermal and non-thermal components have a similar radial scaling, thus a magnetic field decline is inferred.
A radial decrease of the cluster magnetic field strength is also deduced in the framework of halo formation models which consider the reacceleration of the radio emitting electrons. The radial steepening of the synchrotron spectrum, observed in Coma [34] and more recently in A665 [75] and A2163 [75], is interpreted as the result of the combination of the magnetic field profile with the spatial distribution of the reacceleration efficiency, thus allowing us to set constraints on the radial profile of the cluster magnetic field. In Fig. 8 we show the magnetic field profile in the Coma cluster obtained by Brunetti et al. [50] by applying a model for the electron reacceleration. Different lines refer to different values of the reacceleration coefficient. The dots represents the Jaffe [159] theoretical prediction. The field intensity is found to decrease smoothly from ~ 0.5 - 1.5 µG at the cluster center to ~ 0.03 - 0.5 µG at ~ 1.3 Mpc radius, with a trend similar to that of the thermal gas. The magnetic field profiles in A665 [75] and A2163 [75] show a flatter decline, probably because the ongoing violent mergers in these clusters are playing a significant role in determining the conditions of the radiating particles and of the magnetic field.
 |
Figure 8. The magnetic field profile in the Coma cluster obtained from the radial spectral steepening, by applying an electron reacceleration model. The figure is from Brunetti et al. [50], who use H0 = 50 km s-1 Mpc-1. The trends, however, do not depend on the assumed cosmology. Different lines refer to different values of the reacceleration coefficient. The dots represents the Jaffe [159] theoretical predictions for the magnetic field distribution in the Coma cluster. |
Important clues on the magnetic field distribution are also derived from MHD cosmological simulations. Dolag et al. [160, 161] simulated the formation of magnetized galaxy clusters from an initial density perturbation field, using a cosmological MHD code. They found that the µG level field presently observed in clusters can be reproduced by the evolution of the magnetic field starting from an initial field of ~ 10-9 G at redshift 15. This field is amplified by compression during the cluster collapse. They obtained that the process of large-scale structure formation in the universe drives the characteristics of these magnetic fields. One of their results is that the magnetic field strength at any point within galaxy clusters is proportional to the gas density.
In the simple case of adiabatic compression during a spherical
collapse due to gravity, the field lines are frozen into the plasma,
and compression of the plasma results in compression of flux lines.
The expected growth of the magnetic field is roughly proportional to
the gas density as B 
 2/3,
as a consequence of magnetic flux conservation.
2/3,
as a consequence of magnetic flux conservation.
From the simulations, Dolag et al.
[162]
predict the existence of a correlation between the Faraday rotation
measure and the X-ray flux. They find that
 RM increases
with the X-ray flux:
RM increases
with the X-ray flux:
 |
(47) |
with f  1.
1.
The X-ray surface brightness is:
 |
(48) |
The RM dispersion, obtained from Eq. 44,
is related to B and ne. The two observables
RM and
Sx relate the two line of sight integrals
with each other, therefore in comparing these two quantities,
we actually compare cluster magnetic field versus thermal density.
Thus the magnetic field profile can be represented by:
 |
(49) |
In the case of the
 -model (Eq. 45),
the X-ray flux Sx is:
-model (Eq. 45),
the X-ray flux Sx is:
 |
(50) |
By substituting Eq. 49 in the expression of
RM derived
from Eq. 44, we obtain:
 |
(51) |
Thus, by comparing Sx and
RM, one finds
that the index  is related to the slope f and to the parameter
, through:
is related to the slope f and to the parameter
, through:
 |
(52) |
We note that for a constant magnetic field
( = 0) the
slope of the
RM -
Sx correlation
should be f = 0.5 while a steeper slope would imply
> 0.
For the cluster A119, where the polarization properties of
3 extended radio galaxies are available, the
RM -
Sx relation yields
B
ne with
= 0.9.
This implies that the central magnetic field
[162]
in this cluster
is  9 µG,
instead of the
6 µG
inferred by using the constant magnetic field approximation
[140].
9 µG,
instead of the
6 µG
inferred by using the constant magnetic field approximation
[140].
The simulations not only predict that the magnetic field scales
similarly to the density within all clusters but also that
clusters should have different central magnetic
field strengths depending on their temperature, and therefore their mass.
Indeed, the normalization of the
RM -
Sx relation
is expected to be related to the cluster temperature.
In Fig. 9, the predicted
RM -
Sx relation at different cluster temperatures
has been compared with the observations
for a sample of clusters with good RM data.
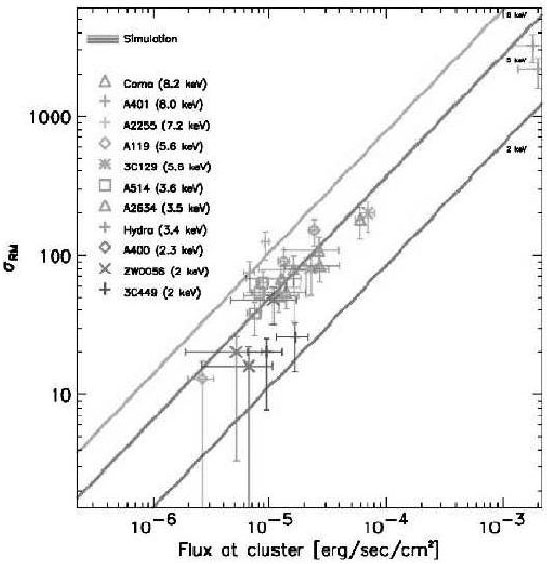 |
Figure 9. The correlation between the observed
|