


Stars are substantially fainter than H II regions, planetary nebulae, or supernova remnants in general, and therefore can only be observed one by one in the Milky Way except for the brightest giants and supergiants, some of which can be observed out to about 10 Mpc. Additionally, abundance measurements in stars come from relatively precise measurements of the depth of absorption features (rather than emission features), therefore requiring more photons for results of similar accuracy. Furthermore, it is usually the more inconspicuous lines from which the most reliable abundances are derived! However, stars have one distinct astrophysical advantage: they are long-lived. Study of stars of different ages can reveal chemical history explicitly, rather than implicitly through chemical evolution models. In this section we briefly survey the extant stellar results for the MWG and external galaxies. A brief description of how abundances are inferred from stellar spectra is provided in Appendix B.
To summarize four decades of work on Milky Way stellar abundances in a
balanced fashion is clearly beyond the scope of a single paper, so we
attempt to provide an executive summary. Workers now subdivide the Milky
Way into the spheroidal halo (r > 2 kpc) and bulge (r
< 2 kpc) and two disklike components, the thick disk (scale height
 1 kpc) and the thin
disk (scale height
350 pc). We now treat
these in order.
1 kpc) and the thin
disk (scale height
350 pc). We now treat
these in order.
The halo has a metal abundance of [Fe/H]
-1.6 ± 1 with
no noticeable abundance gradient.
5 This information comes
from studies of individual subdwarfs
(Carney et al. 1990,
1996).
Globular clusters fall into two spatially and kinematically distinct
groups; the inner, metal-rich disk clusters and the outer, metal-poor
halo clusters. Internal to either group there is no clear abundance
gradient
(Zinn 1996;
Richer et al. 1996).
Increasing evidence suggests that the globular cluster system has a
significant age spread of 3-4 Gyr (see, e.g.,
Hesser et al. 1997),
which may depend on radius: older toward the center. There is also a
pattern of lighter species becoming enhanced relative to Fe-peak
elements in stars more metal poor than about [Fe/H] = -1, with O, Mg,
Al, Si, Ca, and Ti overabundant by several tenths of a dex relative to a
scaled-solar mixture in the metal-poor group
(Wheeler et al. 1989;
Edvardsson et al. 1993).
The standard interpretation is that the metal-poor group was enriched
mainly by Type II supernova nucleosynthesis products and the metal-rich
stars contain a mixture of Type II and Type Ia products, where the Type
Ia supernovae are thought to produce mainly Fe-peak elements.
The Galactic bulge has much foreground dust as well as confusion with
foreground disk stars and thus is a difficult place for observational
work. Photometric studies seem to indicate a negative abundance
gradient, but the size of the gradient is not yet well quantified
(Terndrup 1988;
Frogel, Terndrup, & Whitford 1990;
Harding 1996).
Due to the reddening, spectroscopy seems like a safer way to
proceed. Still, results are ambiguous.
Ibata & Gilmore (1995)
find a near-solar metallicity but no gradient outward from 0.6 kpc, but
Terndrup, Frogel, & Whitford
(1990)
and Rich (1998)
find a gradient of about -0.4 dex kpc-1 (or
 log Z /
log R
-0.6) considering
regions somewhat farther toward the Galactic center.
log Z /
log R
-0.6) considering
regions somewhat farther toward the Galactic center.
The thick disk, massing about 10% of the thin disk, is separable from
the thin disk and halo primarily through kinematics or age, since its
metallicity overlaps at the high end with the thin disk
(Wyse & Gilmore 1995)
and at the low end with the halo
(Nissen & Schuster 1997).
No radial or vertical gradient in [Fe/H] has been discovered in several
large data sets
(Gilmore, Wyse, & Jones 1995;
Bell 1996;
Robin et al. 1996).
The high-quality data of
Edvardsson et al. (1993)
confirms the lack of a strong gradient for heavy elements, but
finds a probable relation between "alpha" elements Si and Ca relative to
Fe as a function of radius over a 4-12 kpc span of about
[ / Fe] /
Rm = +0.03 dex kpc-1, where
Rm is an estimate of the radius at which the
stars were born, rather than where they are presently
located. Similarly,
[ / Fe] has been found
to increase with age. Small-amplitude results of this nature should
become more common as stellar abundances become more accurate.
/ Fe] /
Rm = +0.03 dex kpc-1, where
Rm is an estimate of the radius at which the
stars were born, rather than where they are presently
located. Similarly,
[ / Fe] has been found
to increase with age. Small-amplitude results of this nature should
become more common as stellar abundances become more accurate.
The thin disk can be traced by open clusters, most of which are younger than about half the age of the disk. Friel & Janes (1993) and Thogersen, Friel, & Fallon (1993) worked with moderate resolution spectra of open cluster K giants to obtain a mean [Fe/H] gradient of -0.097 ± 0.017 dex kpc-1 between 7 and 15 kpc. Photometry of open cluster stars has yielded similar results (Panagia & Tosi 1981; Cameron 1985). An alternative to a steady gradient has been proposed by Twarog, Ashman, & Anthony-Twarog (1997), who from a sample of 76 open clusters find a sharp falloff of roughly 0.35 dex at around 10 kpc from the Galactic center with flat gradients interior and exterior to that radius.
Of similar luminosity to K giants are B main-sequence stars. B stars are youthful in age, so their abundances should match those of H II regions. Accurate spectral analysis of oxygen lines in (at least) the hotter B stars is dependent on dropping the assumption of "local thermodynamic equilibrium" between the radiation field and the gas. Smartt & Rolleston (1997) and Gummersbach et al. (1998) have undertaken such an analysis, deriving an [O/H] gradient of -0.07 ± 0.01 dex kpc-1, a result different from most of its predecessors, but in agreement with the nebular results.
Figure 9 shows a summary of the broad-brush
abundance pattern in the Milky Way. The metal-poor halo weighs about
109
M (see,
e.g.,
Freeman 1996)
compared with about 60 × 109
M
for the total mass (in stars) in the Galaxy, so the number of symbols on
the plot does not reflect where the mass is; most of the mass resides in
the disk. Two trends are evident from the figure: abundance increases
with time, and the abundance is higher toward the Galactic
center. Coupled with stellar kinematics and age information, these
abundances give a picture of Galaxy formation in which the halo formed
early and without much chemical enrichment. The disk may have started
early as well, but it is still gas rich and is still forming stars today
at near-solar abundance.
(see,
e.g.,
Freeman 1996)
compared with about 60 × 109
M
for the total mass (in stars) in the Galaxy, so the number of symbols on
the plot does not reflect where the mass is; most of the mass resides in
the disk. Two trends are evident from the figure: abundance increases
with time, and the abundance is higher toward the Galactic
center. Coupled with stellar kinematics and age information, these
abundances give a picture of Galaxy formation in which the halo formed
early and without much chemical enrichment. The disk may have started
early as well, but it is still gas rich and is still forming stars today
at near-solar abundance.
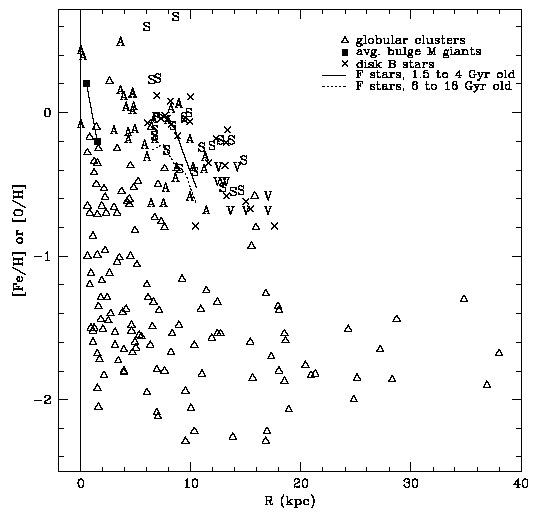 |
Figure 9. Abundances of various tracers are plotted as a function of Galactocentric radius. If nothing else, the complexity of the chemical history of the Milky Way should be evident from this figure. The gross trend with radius and age is pronounced. Abundances of globular clusters were taken from Harris (1996; the 1997 May electronic version) and average M giant metallicities at b = -3° in Baade's window and at b = -12° were taken from Terndrup et al. (1990). FG dwarf data comes from Edvardsson et al. (1993), who were able to separate their stars into age bins. We have averaged over their tabulated age bins to produce "old" and "young" average gradients. As in Fig. 2, the B-star data of Smartt & Rolleston (1997) are shown along with nebular data from Vílchez & Esteban (1996; "V"), Shaver et al. (1983; "S"), and Afflerbach et al. (1997; "A"). |
5 Here we employ the standard bracket
notation often used in expressing abundances, [X]
 log X - log
X, where
X represents an elemental abundance or an abundance ratio. We
will use the symbol Z to represent all heavy elements at once.
Back.
log X - log
X, where
X represents an elemental abundance or an abundance ratio. We
will use the symbol Z to represent all heavy elements at once.
Back.