


12.4.3. Spectra
With the exception of the 21-cm line of neutral hydrogen found only in relatively nearby galaxies, there are no sharp features in the radio spectra of galaxies and quasars, and the observations are confined to measurements of the continuous spectra. Since, unlike optical telescopes, radio-telescopes generally operate only over a limited range of wavelengths, the determination of spectra over a wide range of wavelengths requires combining data obtained by many observers using widely different types of telescopes. Because radio-telescopes may differ widely in their characteristics, each antenna and radiometer system must be separately calibrated at every wavelength where observations are made. Generally, this is done by observing one or more sources whose intensity had previously been determined on an "absolute" scale. Until recently, the problem of obtaining an "absolute" calibration of these primary standards was a formidable one, and the experimental discrepancies discouragingly large. Today, however, the situation is vastly improved and standard sources calibrated with an absolute accuracy of 3 to 10% are available over a wide range of wavelengths. The determination of relative intensities is much easier and is routinely done to an accuracy of a few percent, at least at the shorter wavelengths where confusion from the galactic background is less important.
Hundreds of extra-galactic sources have now been observed over a range of wavelengths extending from a few centimeters to a few meters, and a smaller number over the wider range from a few millimeters to a few tens of meters (10 MHz to 100 GHz). This range of 104 to 1 in wavelength may be compared with the range of only about 2:1 available for ordinary optical spectra. Although a wide variety of spectral shapes are found, no unambiguous distinction exists between the spectra of radio galaxies and those of quasars.
Radio spectra are usually displayed in the form of a logarithmic plot of
flux density vs. frequency. Sources with simple power
law spectra are then represented by a straight line. The spectral index,
 , is defined by the
relation 1 (flux density)
, is defined by the
relation 1 (flux density)
 (frequency).
Although the radio spectra of only a few
sources follow a simple power law accurately,
a spectral index may be defined at any
frequency as the tangent to the curve on a
log S - log plot,
or by the measurement of
flux density at two arbitrarily selected frequencies. The observed
spectra are conveniently divided into three groups
(Figure 12.5) defined by their appearance on a
log S - log plot.
plot,
or by the measurement of
flux density at two arbitrarily selected frequencies. The observed
spectra are conveniently divided into three groups
(Figure 12.5) defined by their appearance on a
log S - log plot.
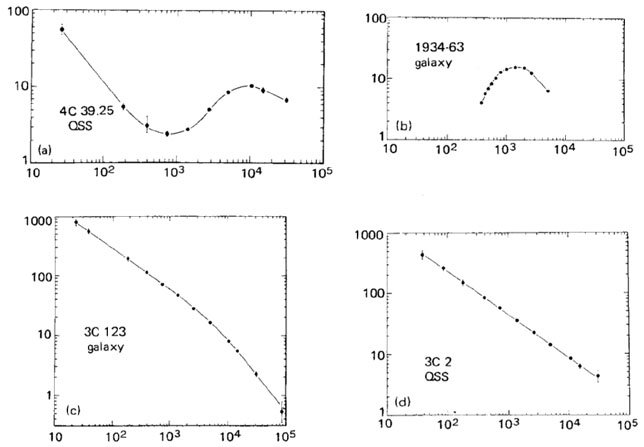 |
Figure 12.5 Radio-frequency spectra of four sources: (a) 4C39.25, Class CPX; (b) 1934-63, Class Cmax; (c) 3C 123, Class C-; (d) 3C2, Class S. |
Class S. Straight spectra. Sources with
Class S spectra generally have indices
near -0.8 with nearly all sources in the range
-1.3 < < -
0.6. There are no Class S spectra with indices flatter than -0.5.
Class C. Curved spectra. Sources with Class C spectra may be further subdivided into three groups:
Class C-. Class C- spectra have a
negative second derivative (defined by the second derivative of the
log S - log
relation), so that the spectrum is steeper at short wavelengths. Typically
the region of curvature extends over a decade or so of wavelength, while at
wavelengths significantly removed from the maximum curvature there are
two well-defined power laws with indices differing by about 0.5.
Class Cmax. Class Cmax spectra have a power law (Class S) or dual power law (Class C-) spectrum at short wavelengths, but a sharp cut-off at long wavelengths, which is probably due to self-absorption.
Class C+. Class C+ spectra have positive curvature and can usually be clearly separated into two groups:
Class Cl+. Class Cl+ have enhanced spectra at long wavelengths.
Class Cs+. Class Cs+ have enhanced spectra at short wavelengths.
Class CPX. Class CPX spectra are complex and show one or more relative minima. CPX spectra are generally believed to be composed of two or more Class Cmax spectra, plus in some cases a Class S spectrum, or one Class Cmax together with a Class S spectrum.
The Class S and Class C- spectra are mostly found in the extended radio sources, which are transparent at radio frequencies, while the Cmax, Cs+, and CPX spectra generally indicate a compact opdque component. Cl+ spectra are typically found in sources located in rich clusters of galaxies.
The histogram of the distribution of spectral indices shows three distinct populations. One, which predominates in the surveys made at relatively long wavelengths, contains class S and C- spectra, with a narrow distribution of indices about a median value near -0.8 and a dispersion of 0.15. The steepest value of the index which is observed for these sources is about -2.0. Very few sources, however, have indices steeper than -1.3. The sources shown in the histogram of Figure 12.6 are mostly of the class S or C-.
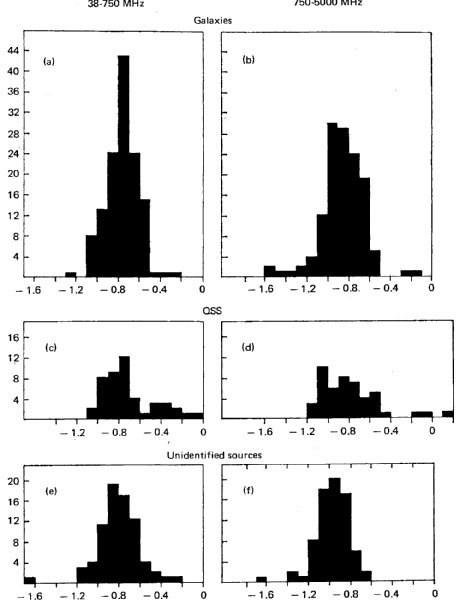 |
Figure 12.6 Histogram showing the
distribution of spectral indices for (a) radio galaxies between
38 and 750 MHz, (b) radio galaxies between 750 and 5000 MHz, (c) quasars
between 38 and 750 MHz,
(d) quasars between 750 and 5000 MHz, (e) the unidentified sources with
| b"| |
A second population, of very steep spectra with
~ - 2 appears in some data
obtained at decameter wavelengths. Because
of the experimental difficulties in measuring
accurate flux densities at long wavelengths,
the fraction of these Cl + spectra which show
this anomalous increase in the decameter flux
is not well determined. Only a single spectrum
of this type is found among the 3CR sources
illustrated in Figure 12.6.
The third population is found mostly in surveys made at shorter wavelengths and consists of sources having flat spectra, and a much broader dispersion in spectral index about a median value near zero. These are all of the type Cmax, Cs +, or CPX associated with compact sources. The preponderance of indices near zero appears to be due to the fact that the form of the spectra in these sources results from the superposition of a number of Class Cmax components, with spectral peaks extending over a range of frequencies. Only a few sources of this type are in the 3C catalog and, as shown in Figure 12.6, these are mostly quasars.
For most of the extended radio sources where the radio brightness distribution has been mapped at several wavelengths, the structure is found to be essentially independent of wavelength. In other words, the spectral index is constant throughout the source. An exception to this, however, is the so-called core-halo source, in which the compact "core" component generally has a very flat spectrum due to synchrotron self-absorption.
Although it is not possible in any individual case to distinguish between radio galaxies and quasars on the basis of their spectra, there do appear to be statistical differences in the spectral distributions for the two classes of identifications. The radio galaxies show mostly class S spectra and, as shown in Figure 12.6, have a narrow dispersion of indices near a median of -0.8. The small "tail" in the distribution toward flat spectra represents sources that are mostly identified with galaxies having prominent optical nuclei, such as Seyfert or N galaxies, but several otherwise normal-looking E galaxies are also included. In the case of the quasars, both spectral populations are represented, but the "flat spectra" population is considerably more prominent than in the case of the galaxies.
The unidentified sources selected from long-wavelength surveys show a spectral distribution which is similar to that of the radio galaxies, although the mean index is somewhat steeper. It is thus possible to interpret these unidentified sources as radio galaxies which are beyond the plate limit of the Palomar Sky Survey. The slightly steeper mean index observed for these sources may be explained if they have dual power law spectra, and the large redshift has moved the high-frequency (steeper) part of the spectrum into the observed frequency range. Detailed investigation of the form of radio source spectra of unidentified radio galaxies, however, indicates that the spectra do not steepen sufficiently at high frequencies for the unidentified sources to be interpreted in this way.
An alternative explanation is that if the identified sources are associated with radio galaxies beyond the plate limit, they must be relatively distant, and thus have a high absolute radio luminosity. The steep spectra observed for the unidentified sources could then reflect a relation between high luminosity and steep spectra (cf. Section 12.4.5).
Because the sources with flat or inverted spectra are relatively weak at long wavelengths, they were not detected in the earlier surveys, which were made at meter wavelengths. As techniques have been pushed toward shorter wavelengths, the fraction of flat spectra sources detected by surveys has increased. Near 6-cm wavelength the observed fraction of flat spectra (opaque) sources and steep spectra (transparent) sources is about equal.
The expected dependence of the spectral
index distribution on observing wavelength
may be easily calculated. Given the normalized spectral index
distribution, P(),
at any wavelength 1
for sources with flux density
stronger than S1, and provided that
P() is independent of
S, the spectral distribution,
Q(),
for all sources stronger than S2 at
2 is then
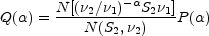 |
(12.1) |
where N(S, ) is
the integral number flux density relation (see Chapter 13).
If N(S)
K Sx where K and x are constants, then
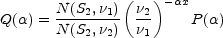 |
(12.2) |
where the first term is simply a normalization constant.
In the special case where
P() is a Gaussian
with a mean index
0 and dispersion
 ,
then Q() is also
Gaussian with the same dispersion
but with a mean index
displaced by the amount
,
then Q() is also
Gaussian with the same dispersion
but with a mean index
displaced by the amount
 |
(12.3) |
Because of the factor
(2 /
1)- x in
Equation (12.2), it is clear that the spectral
index distribution is very frequency-dependent
and that sources with flat spectra dominate
short-wavelength surveys in the same way
that steep spectra dominate the long-wavelength surveys. For example, if
the slope, x, of the
log N - log S relation is taken as 1.5, then
the ratio of flat spectra
( ~ 0) to steep spectra
( ~ - 1) sources for two
surveys made at frequencies one decade apart is 101.5 ~ 32.
This change in the spectral index distribution with sample frequency
should not be confused with the observed change in the
index distribution when a given sample of
sources is observed at different wavelengths.
The brightest n sources which determine
P() at
1 are not the same
n sources which
determine Q() at
2. The change in
spectral distribution of a given sample observed at
different wavelengths is due to spectral curvature.
Comparisons of surveys made at different wavelengths, and of the dependence of the spectral index distribution on wavelength, are in reasonable agreement with that predicted by the expressions above. This means that the full range of spectral population is represented at each observing frequency, although the relative proportion of the two spectral classes may vary considerably.
1 Since for most of the earlier known
sources, the flux density decreased with wavelength, the spectral
index was sometimes defined by (flux density)
frequency-,
so that
was always a positive
number. Now that indices of both signs are known to occur, the
definition given in the text is being more widely used.
Back.
 10°
between 38 and
750 MHz, and (f) the unidentified sources between 750 and 5000
MHz. [Taken from
10°
between 38 and
750 MHz, and (f) the unidentified sources between 750 and 5000
MHz. [Taken from