


12.5.9. Interpretation of Time Variations
The observations of time variations provide direct evidence in some sources of repeated energetic events which may provide a nearly continuous input of energy necessary to account for the observed energy requirements of the extended sources.
The form of the observed intensity variations is most simply interpreted in terms of a cloud of relativistic particles which is initially opaque out to short wavelengths, but which, due to expansion, becomes optically thin at successively longer wavelengths. In its simplest form the model assumes that the relativistic particles initially have a power law spectrum, that they are produced in a very short time in a small space, that the subsequent expansion occurs at a constant velocity, and that during the expansion the magnetic flux is conserved. Thus
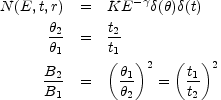 |
(12.40) |
where  is the angular
dimensions, t the elapsed time since the outburst, B the
magnetic field, and the subscripts 1 and 2
refer to measurements made at two epochs tl
and t2. A more detailed mathematical description of
the model has been given by van der Laan for the nonrelativistic
(1966) and the
relativistic (1971)
case. The discussion below follows that of
Kellermann and
Pauliny-Toth (1968).
is the angular
dimensions, t the elapsed time since the outburst, B the
magnetic field, and the subscripts 1 and 2
refer to measurements made at two epochs tl
and t2. A more detailed mathematical description of
the model has been given by van der Laan for the nonrelativistic
(1966) and the
relativistic (1971)
case. The discussion below follows that of
Kellermann and
Pauliny-Toth (1968).
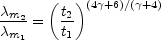
The observed flux density as a function
of frequency,  , and time,
t, is given by
, and time,
t, is given by
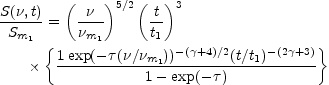 |
(12.41) |
where Sm1 is the maximum flux reached at
frequency
m1
at time t1.
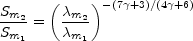
If the optical depth is taken as the value
of  at the frequency,
m, at which the flux
density is a maximum, then it is given by the solution of
at the frequency,
m, at which the flux
density is a maximum, then it is given by the solution of
 |
(12.42) |
The maximum flux density at a given
frequency as a function of time occurs, at a different optical depth,
t, given by the
solution of
 |
(12.43) |
In the region of the spectrum where the source is opaque
( >> 1), the flux density
increases with time as
 |
(12.44) |
Where it is transparent
( << 1), the flux
density decreases as
 |
(12.45) |
The wavelength,
 m, at which
the intensity is a maximum is given by
m, at which
the intensity is a maximum is given by
 |
(12.46) |
and the maximum flux density, Sm, at that wavelength is given by
 |
(12.47) |
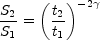
In most variable sources the outbursts occur so rapidly that the emissions from different outbursts overlap both in frequency and time, and so a detailed quantitative analysis is difficult. As pointed out by van der Laan (1966), the spectra of individual bursts are cumulative, suggesting spacially separated outbursts. If the different events occur in the same volume of space, the number of relativistic particles would be cumulative, rather than the spectra.
To the extent that it has been possible to
separate events in some sources, the individual
outbursts seem to follow surprisingly well the
simple model of a uniformly expanding cloud
of relativistic particles. The data relating Sm,
tm, and
m (Equations 12.46
and 12.47) indicate that the initial value of
 is in the
range 1 to 1.5. This agrees with the spectral index
of ~ - 1/4 initially observed in the optically
thin region of the spectrum. At least for one
year following an outburst the expansion
appears to continue at a constant rate, and the value of
is
unchanged by radiation losses or by inverse Compton scattering at
least for < 10 GHz. From
Equation (12.15) this places a limit on the magnetic field of
B0
is in the
range 1 to 1.5. This agrees with the spectral index
of ~ - 1/4 initially observed in the optically
thin region of the spectrum. At least for one
year following an outburst the expansion
appears to continue at a constant rate, and the value of
is
unchanged by radiation losses or by inverse Compton scattering at
least for < 10 GHz. From
Equation (12.15) this places a limit on the magnetic field of
B0
 1 Gauss. From the
requirement that
T < 1012 and Equations (12.22) and (12.25), we
have B0
1 Gauss. From the
requirement that
T < 1012 and Equations (12.22) and (12.25), we
have B0
 0.1 Gauss. Thus
we conclude that B0 ~ 1 Gauss and in those sources where
there are good data the magnetic flux seems
to be approximately conserved, at least
during the initial phases of the expansion.
But because the data from long-baseline interferometer observations when
used in Equation (12.22) indicate that B ~ 10-4 gauss
over a wide range of dimensions for both
variable and nonvariable sources, and since
this is also the value of the field estimated
from minimum energy arguments, it appears
that the flux is conserved for only a limited
time, after which the relativistic particles
diffuse through a fixed magnetic field of about
10-4 Gauss. In this way many repeated outbursts may provide the
particles in the extended sources, although as explained earlier,
this presents formidable energy problems
unless energy is continuously supplied.
0.1 Gauss. Thus
we conclude that B0 ~ 1 Gauss and in those sources where
there are good data the magnetic flux seems
to be approximately conserved, at least
during the initial phases of the expansion.
But because the data from long-baseline interferometer observations when
used in Equation (12.22) indicate that B ~ 10-4 gauss
over a wide range of dimensions for both
variable and nonvariable sources, and since
this is also the value of the field estimated
from minimum energy arguments, it appears
that the flux is conserved for only a limited
time, after which the relativistic particles
diffuse through a fixed magnetic field of about
10-4 Gauss. In this way many repeated outbursts may provide the
particles in the extended sources, although as explained earlier,
this presents formidable energy problems
unless energy is continuously supplied.
In the case of the variable radio galaxies, whose distance can be determined from their redshift, the initial dimensions appear to be well under one light year and the initial particle energy in a single outburst about 1052 ergs. Repeated explosions over a period of 108 years at a rate of one per year are required to account for the minimum total energy in the extended sources, but even this falls short by a factor of about 105 if account is taken of energy lost during the expansion.
The direct measurement of the angular size and expansion rate of variable sources using long-baseline interferometry is now possible, and can be used to determine uniquely the magnetic field (Equation 12.18), and when the distance is known the total energy involved in each outburst (Equations 12.25 and 12.27).
The model of a uniform isotropic homogeneous instantaneously generated
sphere of relativistic electrons, which expands with a
uniform and constant velocity, where magnetic flux is conserved, and
where the only energy loss is due to expansion, is mathematically
simple. Clearly, such sources are not expected to exist in the real
world, and it is indeed remarkable that the observed variations follow
even approximately the predicted variations. A more realistic model must
take into account nonconstant expansion
rates, the nonconservation of magnetic flux,
changes in ,
the finite acceleration time for
the relativistic particles, and the initial finite
dimensions. But these are relatively minor
modifications, and the observed departures
from the predictions of the simple model
should not, as is sometimes done, be used to
infer that the general class of expanding
source models is not relevant to the variable
source phenomena. Rather the departures
from the simple mathematical model can be
used to derive further information about the nature of the source.
In the case of the continued production
of relativistic particles, or where the initial
volume of the source is not infinitely small,
the initial spectrum is not opaque out to very
short wavelengths, and the source is always
transparent at frequencies higher than some critical frequency,
0. In the
transparent region of the spectrum the flux variations occur
simultaneously and reflect only the rate of
particle production and/or decay due to
synchrotron and inverse Compton radiation.
The experimental determination of
0
may be used to estimate the initial size of the
source. Characteristically
0 ~ 10 to 30 GHz,
corresponding to initial dimensions of about
10-3 are second for B ~ 1 Gauss. For typical
radio sources with 0.1 < z < 1, the initial
size derived in this way is from 1 to 10 light
years. This is roughly consistent with the
direct determination of the angular sizes
made by long-baseline interferometry, but it
must be emphasized that so far these measurements have not been made in
sufficient detail to permit a detailed comparison, or to estimate from
Equation (12.21) the initial magnetic field.
In those sources where good data exist in the spectral region
>
0, the observed
variations occur simultaneously as expected
from the model, and with equal amplitude,
indicating an initial spectral index
 ~ 0, or
~ 1, in
good agreement with the value of
derived from Equations (12.46) and (12.45).
~ 0, or
~ 1, in
good agreement with the value of
derived from Equations (12.46) and (12.45).
In the spectral region >
0, the observed
flux variations depend on the total number of
relativistic particles, their energy distribu
tion, and the magnetic field. Thus observations in this part of the
spectrum reflect the rate of generation of relativistic particles
more closely than observations in the opaque part of the spectrum.
In some sources 0
occurs at relatively low frequencies of 1 or 2 GHz. This poses a
serious problem, for the following reason. If
variations occur on a time scale of the order
of , then it is commonly
assumed that the dimension of the emitting region, l, is less
than c, since otherwise the light travel time
from different parts of the source to the observer would "blur" any
variations which occur. Using the distance obtained from the
redshift, a limit to the angular size,
, may
be calculated, and from Equation (12.22) an
upper limit to the magnetic field strength is obtained.
For a typical quasar, such as 3C 454.3,
~ 1 yr, z ~ 1,
10-4
arc second, and
B
10-5 Gauss. With such weak fields the
energy required in relativistic particles is very high and is
1058
ergs, and the repeated
generation of such enormous energies in times
of the order of one year or less is a formidable
problem. Also the limit to the angular size
deduced from the light travel time argument
often results in a peak brightness temperature
which may exceed the expected maximum
value of 1012 K (Equation 12.24). For these
reasons it has been questioned by some
whether or not in fact the quasars are at the
large distances indicated by their redshifts (e.g.,
Hoyle, Burbidge, and
Sargent, 1969),
or whether they do indeed radiate by the ordinary synchrotron process.
One way in which the theoretical brightness temperature limit may be exceeded is if the relativistic electrons are radiating co herently. Stimulated emission or negative absorption leading to coherent radiation is possible in opaque synchrotron sources, if the relativistic electrons are moving in a dispersive medium where the index of refraction is less than unity.
However, other than the seemingly excessive brightness temperature implied by some of the variable source observations, the ex panding source model and the ordinary incoherent synchrotron process appear to be adequate to explain all of the observed phenomena.
Another way to explain the rapid variations was pointed out by
Rees (1967),
who showed that if the source is expanding at a
velocity v ~ c, then the differential light
travel time between the approaching and receding parts of the source can
cause the illusion of an angular expansion rate corresponding to
an apparent linear velocity v > c. In
this case the angular size and peak brightness
temperature are larger than suggested by the
observations; and from Equation (12.36),
which depends on a high power of
, the
required particle energy is greatly reduced.
However, there is a limit to the extent that the
total energy requirements can be reduced by
this "super-light" expansion theory, since as
the particle energy is decreased when
is
increased, the magnetic energy is increased.
The minimum value of the total energy
occurs when the two are approximately equal,
and for the typical quasar it is ~ 1055 ergs (e.g.,
van der Laan, 1971).
Unfortunately, the variation in total intensity for the relativistically expanding source is very similar to that for the nonrela tivistic model, so that they cannot be easily distinguished merely from observations of the intensity variations. The direct observations of the variations in angular size likewise do not distinguish between "superlight" velocities at cosmological distances and nonrelativistic velocities in a "local" model for quasars.
An interesting variation on the expanding source model has been suggested by the Russian astrophysicists Ozernoy and Sazonov (1969), who propose that two or more discrete components are "flying apart" at relativistic velocities, while at the same time expanding. Evidence for relativistic component velocities has been obtained from long-baseline interferometer observations, but with the meager data so far available it has not been possible to uniquely distinguish between actual component motions and properly phased intensity variations in stationary components.
It may be expected, however, that future observations of intensity variations as a function of wavelength, when combined with the direct observation of the variations in angular size, not only will uniquely determine the dynamics and energetics of the radio outbursts, but also will specify the initial conditions of the outburst with sufficient accuracy to limit the range of theoretical speculation concerning the source of energy and its conversion to relativistic particles. In particular, there must be increased emphasis on observations made at the shortest possible wavelengths, since these most nearly reflect the conditions during the time just following the outburst (Equation 12.44).