


13.1.3. Radio Spectra
With the exception of the 21-cm line of neutral hydrogen, H2O and OH found only in relatively nearby galaxies, there are no sharp features in the radio spectra of galaxies and quasars, and the observations are confined to measurements of the continuous spectra. Since individual radio telescopes generally operate only over a limited range of wavelengths, the determination of broadband spectra requires the combination of data obtained by many observers using many different types of telescopes. Because radio telescopes may differ widely in their characteristics, each antenna and radiometer system must be separately calibrated at every wavelength where observations are made. Generally, this is done by observing one or more sources whose intensity is known on an "absolute" scale. Standard sources calibrated with an absolute accuracy of a few percent are available over a wide range of wavelengths from short millimeter wavelengths to wavelengths of a few meters. The determination of relative intensities is much easier, at least at the shorter wavelengths where confusion from the galactic background is less of a problem.
Thousands of extragalactic sources have now been observed at decimeter and centimeter wavelengths, and for several hundred sources the spectra are complete over a range of wavelengths extending from a few millimeters to a few tens of meters (10 MHz to 100 GHz). In a few cases, the spectra extend to 1 mm (300 GHz), but measurements at short millimeter wavelengths are difficult due to the variable opacity of the atmosphere.
Radio spectra are usually displayed in the form of a logarithmic plot of
flux density versus frequency (see
Figure 13.3). Sources with power law
spectra are then represented by a straight line, with slope equal to the
spectral index,  . Although
the radio spectra of only a few sources follow such a simple power law
accurately,
a spectral index may be defined at any frequency as the derivative
d (log S) / d
(log
. Although
the radio spectra of only a few sources follow such a simple power law
accurately,
a spectral index may be defined at any frequency as the derivative
d (log S) / d
(log )
or by the measurement of flux density at two arbitrarily selected
frequencies. The observed spectra of extended sources generally show
negative curvature in the
log S - log plane,
that is, the spectrum becomes more steep at
high frequency. Typically the region of curvature extends over a decade
or so of frequency. At frequencies significantly removed from the
maximum curvature, the spectrum can
be represented by two well-defined power laws. Values of the spectral
index of the extended radio features are in the range
-1.3 < < - 0.5,
and over a wide
range of frequencies show a strong concentration near -0.8 with a
dispersion of only 0.15. The steepest spectral index which is observed
is about -2.0 and the flattest about -0.5.
)
or by the measurement of flux density at two arbitrarily selected
frequencies. The observed spectra of extended sources generally show
negative curvature in the
log S - log plane,
that is, the spectrum becomes more steep at
high frequency. Typically the region of curvature extends over a decade
or so of frequency. At frequencies significantly removed from the
maximum curvature, the spectrum can
be represented by two well-defined power laws. Values of the spectral
index of the extended radio features are in the range
-1.3 < < - 0.5,
and over a wide
range of frequencies show a strong concentration near -0.8 with a
dispersion of only 0.15. The steepest spectral index which is observed
is about -2.0 and the flattest about -0.5.
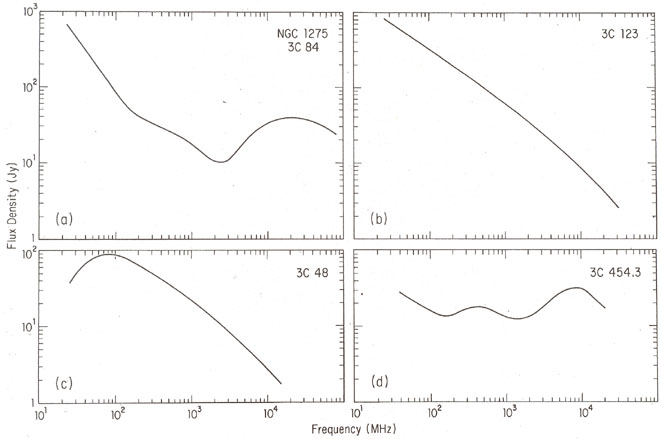 |
Figure 13.3. Typical radio-frequency spectra: (a) the radio galaxy 3C84, showing low-frequency power law component which comes from the large-scale structure, an intermediate-size feature which becomes opaque at a frequency of a few GHz, and the small nuclear source which is opaque below 20 GHz; (b) the radio galaxy 3C123 which is transparent throughout the observed range of frequency but has a spectrum which steepens at high frequencies; (c) the quasar 3C48 which has a self-absorption cutoff near 100 MHz and is transparent at higher frequencies; and (d) the quasar 3C454.3 which has multiple peaks due to the superposition of several features which become opaque at widely different frequencies. |
Radio sources or components of sources with spectra flatter than -0.5 are nearly always very compact, and are coincident with a quasar or AGN. In these sources, the flat spectrum is thought to be the result of self-absorption, rather than a flat electron energy distribution. In some sources, particularly quasars and BL Lac objects, the spectra remain opaque at least up to a few hundred GHz but steepen at the infrared and optical wavelengths to a spectral index of about -1 (e.g., Ennis et al. 1982, Landau et al. 1983, Bregman et al. 1986, Roellig et al. 1986). Some sources show a flattening toward the near UV, which is often referred to as the "3000 Å, bump." In general, only about ten percent of the radiation from quasars and AGNs is emitted at radio wavelengths, with most of the power being radiated at submillimeter wavelengths.
In the extended regions, where the relativistic plasma is transparent
(optically thin) to its own radiation, and the observed spectral flux
density is merely the sum of the radiation from the individual electrons
and reflects the distribution, N(E),
of relativistic particle energy (see Chapter 1). In the case of a power
law distribution of particle energies,
N(E) = KE-p, the radiation spectrum is a
power law with S  , where the spectral
index ~ (1 - p) / 2
(Equation 1.14). The characteristic spectral index
~ - 0.8 frequently
found in the extragalactic sources then corresponds to a value of
p ~ 2.6, which is close to
the index of primary cosmic-ray particles in the Galaxy.
, where the spectral
index ~ (1 - p) / 2
(Equation 1.14). The characteristic spectral index
~ - 0.8 frequently
found in the extragalactic sources then corresponds to a value of
p ~ 2.6, which is close to
the index of primary cosmic-ray particles in the Galaxy.
Even if relativistic electrons are initially produced with a power law distribution, differential energy losses will alter the energy spectrum, so that it is steeper at higher energy. Relativistic electrons lose energy by synchrotron radiation and by the inverse Compton effect, which are both proportional to the square of the energy; by ordinary bremsstrahlung and adiabatic expansion, which are directly proportional to the energy; and by ionization, which is approximately proportional to the logarithm of the energy. Approximating the logarithmic term by a constant, the rate of energy loss may be written
 |
(13.1) |
If the electrons are being supplied to the source at a rate N(E, t), then the equation of continuity describing the time dependence of the energy distribution N(E, t) is
 |
(13.2) |
It is of interest to consider the case where synchrotron losses dominate (b = c = 0). Then from Equation (1.10), a = - 120 B2. If the initial particle distribution is a power law of the form N(E) = K E-p between E t1 and E2, and zero elsewhere, and if there is no continual injection or acceleration, then the energy distribution will remain a power law with the same slope, but with an amplitude which decreases with time according to
 |
(13.3) |
where E' = E / (1 + 120 B2 E t). Thus, even with an initial energy distribution extending to unlimited energy, after a time t years, there will be an upper energy cutoff at
 |
From Equation (1.8) there is a corresponding cutoff in the synchrotron
radiation spectrum at a frequency
b ~
B-3t (yr)-2 GHz.
If the distribution of electron pitch angles is random, the cutoff
frequency for each pitch angle differs. At low frequencies where energy
losses are not important, the
spectral index, a, remains equal to its initial value
0 = (1 -
p) / 2. If the pitch angle distribution is conserved, then for
>>
b,
= 4/3
(0 - 1)
(Kardashev 1962).
If, on the other hand, the pitch angle distribution is continuously made
random, for example, by irregularities in the magnetic field, then all
the electrons see the same effective magnetic field and the spectrum
will show the same sharp cutoff which is
observed with a single pitch angle. No such cutoff is observed, even for
those sources whose spectra are determined out to 100 GHz or more.
If relativistic electrons are continuously injected with
Q(E) = K E-p0, then for
<<
b the spectral
index again remains constant with
=
0
[0 = (1 -
p0) / 2]. But
for >>
b
where the rate of energy loss is balanced by
the injection of new particles,
the equilibrium solution of Equation (13.2) with
( N /
t) = 0 gives
=
(0 - 1/2).
N /
t) = 0 gives
=
(0 - 1/2).
Observations over the frequency range 10 MHz to 100 GHz show curvature of
the form expected from synchrotron radiation losses, with
b ~ 1 GHz. Typically,
 ~ 1/2, as expected if
relativistic electrons are continually supplied. If a few sources
~ 1, suggesting that in
these sources particle acceleration may have ceased.
~ 1/2, as expected if
relativistic electrons are continually supplied. If a few sources
~ 1, suggesting that in
these sources particle acceleration may have ceased.
Quantitative analysis is difficult, since the spectra may vary across the source, particularly if the magnetic field is not constant. Generally, the hot spots and jets appear to have flatter spectra than the more extended diffuse components, apparently reflecting their younger ages and correspondingly smaller synchrotron radiation losses. The very diffuse components associated with clusters have the steepest observed radio spectra with indices generally steeper than -1.