


As has been noted long ago, Compton scattering of the CMB by relativistic
electrons boosts photon energies to the X-ray and
 -ray
regions. Measurement of this radiation provides additional information
that enables the determination of the electron density and mean magnetic
field directly, without the need to invoke equipartition. The mean
strength of the magnetic field which is deduced from the radio and NT
X-ray fluxes, Brx, is essentially a volume average
over the emitting
region. The detection of IC radio and NT X-ray emission sets the stage
for a more meaningful study of the origin of magnetic fields and
cosmic rays in extragalactic environments.
-ray
regions. Measurement of this radiation provides additional information
that enables the determination of the electron density and mean magnetic
field directly, without the need to invoke equipartition. The mean
strength of the magnetic field which is deduced from the radio and NT
X-ray fluxes, Brx, is essentially a volume average
over the emitting
region. The detection of IC radio and NT X-ray emission sets the stage
for a more meaningful study of the origin of magnetic fields and
cosmic rays in extragalactic environments.
The focus of this review are measurements of NT X-ray emission in large extended IC regions. NT emission is obviously predicted within dominant radio galaxies in the centres of clusters and in their radio halos. This emission has been sought in several galaxies including NGC 1275 in the Perseus cluster (e.g., Sanders & Fabian 2003) and M 87 in Virgo (Simionescu et al. 2007), but does not seem to have been detected. The mapping of the electron spectrum in these inner regions clearly provides crucial information on the initial source of IC relativistic electrons and most likely also energetic protons, whose energy input and heating of the gas could possibly be important in the inner core of Perseus (Rephaeli & Silk 1995) and other clusters. NT X-ray emission in these environments is quite complex due to its multi-source (AGN, jet, binaries, and halo), temporally variable nature. A discussion of NT emission in these essentially galactic environments is out of the scope of our review.
The prospects for measuring cluster NT X-ray emission motivated detailed
calculations of the predicted emission
(Rephaeli
1977,
1979).
In these
calculations the relativistic electron spectrum was directly related to the
measured radio spectrum and no attempt was made to model the spectra of
possible energetic electron populations. Energetic protons, which are a
major Galactic cosmic ray component, are also expected in the IC space,
particularly so in the inner cores of clusters dominated by a radio
galaxy. Their interactions with protons in the gas produce neutral and
charged pions, whose decays yield
-ray
emission and secondary electrons (e.g.,
Dennison 1980,
Dermer &
Rephaeli 1988,
Blasi &
Colafrancesco 1999).
Energetic protons also deposit energy and heat IC gas through their
Coulomb interactions with electrons and protons in the gas
(Rephaeli
1987,
Rephaeli &
Silk 1995).
With mean field values in the range of 0.1 -1 µG, the energy range of electrons emitting at the observed radio frequencies is ~ 1-100 GeV. Of course, electrons with energies outside this range are also expected, either as part of the same or a different population. In particular, NT Bremsstrahlung EUV and X-ray emission by (the more numerous) lower energy electrons would also be expected (Kaastra et al. 1998, Sarazin 1999). However, at energies below ~ 200 MeV, the main energy loss is electronic excitations in the gas (Rephaeli 1979); this sets a stringent limit on the contribution to the NT X-ray emission by a low energy electron population (Rephaeli 2001, Petrosian 2001). We will therefore assume that NT X-ray emission is largely due to Compton scattering of radio-emitting electrons by the CMB.
The main characteristics of the predicted Compton-produced emission are: (a) X-ray to radio flux ratio is roughly equal to the ratio of the CMB energy density to the magnetic field energy density. (b) Power-law index is nearly equal to the radio index. (c) Matching X-ray and radio centroids, with the X-ray spatial profile generally shallower than that of the radio emission. These features are expected only if the Compton-produced emission is identified and separated from other contributions, the primary thermal emission as well as NT emission from relics and individual galaxies. Due to source confusion, as well as other systematic and observational uncertainties, spatial information is crucially needed in order to clearly identify the origin of NT X-ray emission.
We first briefly summarise the required sensitivity and level of spatial resolution for the detection of NT emission, and then review the results of the search for this emission with the HEAO-1, CGRO, RXTE, BeppoSAX, Suzaku, and INTEGRAL.
3.1. Instrumental Requirements
Cluster X-ray emission is primarily thermal up to ~ 30-40 keV; therefore, clear identification of NT emission necessitates also precise measurement of the thermal emission in order to account for and separate it from the sought NT component. The required detector spectral range must therefore extend down to sufficiently low energies.
Using standard expressions for Compton and synchrotron emission from
the same population of relativistic electrons, the predicted level of
Compton-produced emission from nearby clusters with measured radio halos
can be readily estimated. Since imaging information at the high energy
X-ray regime ( >
30) is minimal at best, we will ignore spatial
factors in the Compton-synchrotron formulae (e.g.,
Rephaeli 1979)
that include integrals over the relativistic electron and magnetic
fields spatial
profiles. This is valid as long as the NT X-ray emission region
coincides with the radio region. We base our estimate of the required
detector sensitivity on the level of radio emission as measured in the
nearby clusters with well measured halos (such as Coma, A 2256, A 2319),
for which the feasibility of detection of the NT emission is likely to
be highest. Using the range of values for radio spectral index and
flux, we estimate the level of NT flux at 40 keV to be typically
~ 1 × 10⁻⁶ cm-2 s-1
keV-1 and an integrated flux of ~ 3 × 10⁻⁵
cm-2 s-1 in the
40-80 keV band, if the mean field (across the emitting region) is
B ~ 0.3 µG. The value of the field is critical due
to the strong B dependence of the flux, with a power-law exponent
typically larger than 2. For example, the predicted flux in the
Coma cluster is some 16 times lower if B = 1
µG.
>
30) is minimal at best, we will ignore spatial
factors in the Compton-synchrotron formulae (e.g.,
Rephaeli 1979)
that include integrals over the relativistic electron and magnetic
fields spatial
profiles. This is valid as long as the NT X-ray emission region
coincides with the radio region. We base our estimate of the required
detector sensitivity on the level of radio emission as measured in the
nearby clusters with well measured halos (such as Coma, A 2256, A 2319),
for which the feasibility of detection of the NT emission is likely to
be highest. Using the range of values for radio spectral index and
flux, we estimate the level of NT flux at 40 keV to be typically
~ 1 × 10⁻⁶ cm-2 s-1
keV-1 and an integrated flux of ~ 3 × 10⁻⁵
cm-2 s-1 in the
40-80 keV band, if the mean field (across the emitting region) is
B ~ 0.3 µG. The value of the field is critical due
to the strong B dependence of the flux, with a power-law exponent
typically larger than 2. For example, the predicted flux in the
Coma cluster is some 16 times lower if B = 1
µG.
Given the great difficulty in detecting the predicted NT flux at
energies
 40 keV, it is only
reasonable to search for
it also at lower energies. To do so optimally would require a
high-sensitivity detector that covers a wider spectral band than
that of any previously flown instrument. Combining measurements made
with two different detectors is problematic, given the inherent
difficulty in the requisite precise cross-calibration (at the
~ 1% level) of signals from detectors on the same satellite,
and even more so when the detectors were on different satellites
altogether. An added difficulty arises in the extremely difficult
task of detecting a weak secondary component at energies below
~ 1 keV where photoelectric absorption is strong. This should
be kept in mind when assessing results form such combined analyses,
some of which are discussed below.
40 keV, it is only
reasonable to search for
it also at lower energies. To do so optimally would require a
high-sensitivity detector that covers a wider spectral band than
that of any previously flown instrument. Combining measurements made
with two different detectors is problematic, given the inherent
difficulty in the requisite precise cross-calibration (at the
~ 1% level) of signals from detectors on the same satellite,
and even more so when the detectors were on different satellites
altogether. An added difficulty arises in the extremely difficult
task of detecting a weak secondary component at energies below
~ 1 keV where photoelectric absorption is strong. This should
be kept in mind when assessing results form such combined analyses,
some of which are discussed below.
Even if NT emission is detected its origin has to be verified before it is identified with electrons in the halo. The first requirement is that the measured emission does not show any temporal variation (that would usually imply AGN origin). Sizes of radio halos in nearby clusters are in the range of 15' - 30', which in principle can be resolved by the IBIS instrument aboard INTEGRAL, the first imaging experiment in the high energy X-ray regime. Clearly, higher detector sensitivity is required for resolved measurements of such large regions. All the other presently active (and previous) satellites with high energy spectral capability have FOVs that are larger than the halos of (even) nearby clusters. Measurements of NT emission have so far been solely spectral, thus providing only the necessary - but not sufficient - evidence for the detection of NT emission in a few clusters.
3.2. Initial search for NT X-ray emission
Systematic searches for NT X-ray emission began with the analysis of archival HEAO-1 measurements of six clusters (Coma, A 401, A 2142, A 2255, A 2256, A 2319) with measured radio halos (Rephaeli et al. 1987, Rephaeli & Gruber 1988), and continued with CGRO observation of the Coma cluster (Rephaeli et al. 1994). No significant NT emission was detected, resulting in lower limits on the mean, volume-averaged magnetic fields in these clusters, Brx = O(0.1 µG).
Observation of the Coma cluster with the CGRO/OSSE experiment for ~ 380 ks was the first dedicated measurement of a cluster aimed at measuring NT emission. The fact that the predicted emission was not detected clearly established that instruments with higher detector sensitivity, significantly lower level of internal background, and much smaller FOV (than that of OSSE, ~ 1° × 1° FWHM), are the minimal requirements for measurement of emission in the 40-100 keV band.
Attempts to measure NT emission from clusters continued with all subsequent X-ray satellites whose nominal spectral band extended beyond 10 keV. First observational evidence for NT emission came from long measurements with the RXTE and BeppoSAX satellites, as discussed in the next two subsections, followed by a review of results from ASCA, initial results from Suzaku/HXD, and the first spatial analysis of INTEGRAL/IBIS observations of the Coma cluster.
3.3. Search for NT emission with RXTE
The search for cluster NT emission advanced significantly through long observations with the PCA and HEXTE experiments aboard the RXTE satellite. These instruments have the minimally required capabilities for detection of a weak NT spectral component - sufficiently high sensitivity for precise measurement of the primary thermal emission, and good background subtraction achieved by (on and off source) `rocking' of the HEXTE detectors. The crucial RXTE features which are essential for identifying the small NT component are spectral overlap of the two experiments over the effective (narrower than nominal) ~ 13-25 keV band, and the same triangular spatial response function with 58' FWHM. As has been noted already, the RXTE does not have the capability to resolve the emission even in nearby (rich) clusters, implying that the exact origin of NT emission cannot be identified even when a secondary spectral component is clearly detected.
We review here results of searches for NT components in the spectra of clusters that were observed for at least ~ 100 ks. Shorter observations were mostly aimed at measurement of the primary thermal emission, with the exception of a 70 ks observation of A 754 (Valinia et al. 1999), and even shorter ~ 30 ks observations of A 2256 (Henriksen 1999) and A 1367 (Henriksen & Mushotzky 2001), which resulted in upper limits on NT emission in these clusters. For obvious reasons, Coma was the first cluster searched for NT emission with RXTE (Rephaeli et al. 1999). The search continued with long observations of A 2319, A 2256, and A 2163, all with observed radio halos. Results of the search for NT emission in these and other clusters are listed in Table 1, and briefly described below.
| Cluster | 20-80 keV flux |  |
Brx | Reference |
| (10-12 erg s-1 cm-2) | (µG) | |||
| Coma | 21 ± 6 | 2.1 ± 0.5 | 0.1-0.3 | Rephaeli & Gruber (2002) |
| A 2163 | 11-9+17 | 1.8-4.2+0.9 | 0.4 ± 0.2 | Rephaeli et al. (2006) |
| A 2256 | 4.6 ± 2.4 | 2.2-0.3+0.9 | 0.2-0.1+1.0 | Rephaeli & Gruber (2003) |
| A 2319 | 14 ± 3 | 2.4 ± 0.3 | 0.1-0.3 | Gruber & Rephaeli (2002) |
| A 3667 |  4 4 |
~ 2.1 | 0.4 |
Rephaeli & Gruber (2004) |
| 1ES 0657-55.8 | ~ 5 ± 3 | 1.6 ± 0.3 | 1.2 a | Petrosian et al. (2006) |
| All quoted errors are at the 90% confidence level. | ||||
| a The magnetic field value in 1ES 0657-558 was derived assuming energy equipartition between the field and particles. | ||||
Coma: The cluster was initially observed (in
1996) for ~ 90 ks with the PCA, and for ~ 29 ks with HEXTE.
Analysis of these measurements showed evidence for the presence
of a second spectral component at energies up to ~ 20 keV
(Rephaeli et
al. 1999),
but the nature of the secondary emission could not
be determined. In order to improve the quality of the spectral results,
the cluster was observed again (in 2000) for ~ 177 ks. Analysis
of the new observations
(Rephaeli
& Gruber 2002,
hereafter RG02) yielded
results that are consistent with those from the first observation. Joint
analysis of the full RXTE dataset shows that - from a statistical
point of view - no preference could be determined for the nature of the
secondary component. If thermal, the most probable temperature would be
very high, kT2
 37.1 keV, but at its
lowest boundary, the 90%
contour region includes a much lower, physically more acceptable value.
However, the best fit combination of the temperatures of the primary and
secondary components is then kT1 = 5.5 keV, and
kT2 = 9 keV,
respectively, with the respective 4-20 keV fractional fluxes of ~
24% and ~ 76%. RG02 argued that it is quite unlikely that about
a quarter of the emission comes from gas at a significantly lower
temperature than the mean value deduced by virtually all previous X-ray
satellites. In particular, such a component would have been detected in
the high spatially resolved XMM and Chandra maps of the
cluster.
37.1 keV, but at its
lowest boundary, the 90%
contour region includes a much lower, physically more acceptable value.
However, the best fit combination of the temperatures of the primary and
secondary components is then kT1 = 5.5 keV, and
kT2 = 9 keV,
respectively, with the respective 4-20 keV fractional fluxes of ~
24% and ~ 76%. RG02 argued that it is quite unlikely that about
a quarter of the emission comes from gas at a significantly lower
temperature than the mean value deduced by virtually all previous X-ray
satellites. In particular, such a component would have been detected in
the high spatially resolved XMM and Chandra maps of the
cluster.
To quantitatively assess the possibility that a two-temperature gas model is
just a simplified representation of a more realistic continuous temperature
distribution, RG02 have assumed a polytropic gas temperature profile of
the form
T(r)  n(r)-1, with a
 profile
for the gas density,
n(r) (1
+ r2 / rc2)-3/2, where
rc is
the core radius. With these profiles they calculated the integrated flux
and the mean emissivity-weighted temperatures as functions of
,
, and
r. These quantities were then calculated in the projected (2D)
circular regions [0, R] and [R, R0] by
convolving over the triangular response of the PCA with R0
58'. From ROSAT
observations, rc ~
10.0', and
0.70 ± 0.05
(Mohr et
al. 1999).
The range of values
of R, ,
and for
which the two mean emissivity-weighted
temperatures and respective fluxes from these regions were closest to
the values deduced from the spectral analysis, were then determined. The
results of these calculations indicate that for 0.5
0.9 and 1
5/3, there is no acceptable
polytropic configuration that matches the
observationally deduced values of the temperatures and fractional
fluxes. For low values of
the
temperature gradient is too shallow, whereas for high
values the
implied central temperature is unrealistically high. Based
on these results RG02 concluded that the two thermal components model
does not seem to be consistent with the RXTE measurements, but
certainly could not be ruled out.
profile
for the gas density,
n(r) (1
+ r2 / rc2)-3/2, where
rc is
the core radius. With these profiles they calculated the integrated flux
and the mean emissivity-weighted temperatures as functions of
,
, and
r. These quantities were then calculated in the projected (2D)
circular regions [0, R] and [R, R0] by
convolving over the triangular response of the PCA with R0
58'. From ROSAT
observations, rc ~
10.0', and
0.70 ± 0.05
(Mohr et
al. 1999).
The range of values
of R, ,
and for
which the two mean emissivity-weighted
temperatures and respective fluxes from these regions were closest to
the values deduced from the spectral analysis, were then determined. The
results of these calculations indicate that for 0.5
0.9 and 1
5/3, there is no acceptable
polytropic configuration that matches the
observationally deduced values of the temperatures and fractional
fluxes. For low values of
the
temperature gradient is too shallow, whereas for high
values the
implied central temperature is unrealistically high. Based
on these results RG02 concluded that the two thermal components model
does not seem to be consistent with the RXTE measurements, but
certainly could not be ruled out.
Clearly, a search for NT emission motivated the long observation, and
this alternative origin was assessed in detail by RG02. Since emission
from an AGN in the FOV was considered unlikely, they assessed whether the
secondary emission is due to Compton scattering of relativistic electrons
whose presence in Coma is directly inferred from many measurements of
spatially extended region of radio emission (e.g.
Kim et al. 1991,
Giovannini
et al. 1993,
Thierbach et
al. 2003).
From the measured radio spectral
index, 1.34 ± 0.1, it follows that the predicted power-law (photon)
flux from Compton scattering of these electrons by the CMB should have an
index ~ 2.3. A
power-law fit to the secondary
component yielded 2.1 ± 0.5 at the 90% confidence level (CL).
Results of this fit are shown in Fig. 1.
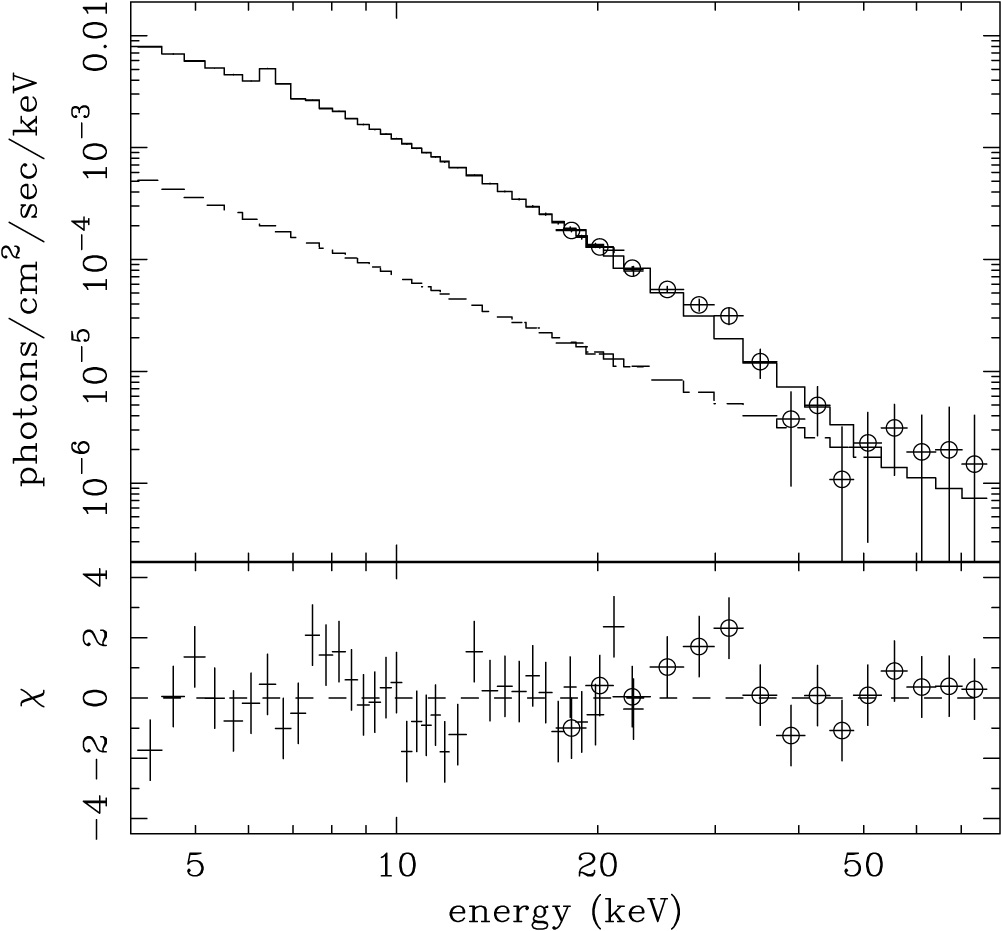 |
Figure 1. The RXTE spectrum of the
Coma cluster and folded Raymond-Smith
(kT |
With the measured mean radio flux of 0.72 ± 0.21 Jy at 1 GHz, and the deduced level of power-law X-ray flux, the mean volume-averaged value of the magnetic field, Brx, was computed to be in the range 0.1 - 0.3µG. As noted by RG02, this estimate is based on the assumption that the spatial factors in the theoretical expressions for the two fluxes (Rephaeli 1979) are roughly equal, an implicit assumption made in virtually all previous attempts to derive the strength of cluster fields from radio and X-ray measurements.
A similar procedure was employed in analyses of observations of the other clusters (A 2319, A 2256, and A 2163) that were initiated by Rephaeli & Gruber.
A 2319: The cluster was observed (in 1999)
for ~ 160 ks. Analysis of the data
(Gruber &
Rephaeli 2002)
showed no noticeable
variability over the ~ 8 week observation. The quality of the
data allowed a meaningful search for emission whose spectral
properties are distinct from those of the primary thermal emission
with measured mean temperature in the range 8-10 keV.
A fit to a single thermal component yielded kT = 8.6
± 0.1 (90 % CL), a low iron abundance ZFe ~ 0.16
± 0.02, and large positive residuals below 6 keV and between 15 to
30 keV. The quality of the fit was very significantly improved when a
second component was added. A two-temperature model yielded
kT1
10.1 ± 0.6, kT2
2.8 ± 0.6, and
ZFe ~
0.23 ± 0.03, a value consistent with previously measured values. An
equally good fit was obtained by a combination of primary thermal and
secondary NT components, with kT
8.9 ± 0.6, and
photon index
2.4 ±
0.3. Similar results were obtained when a joint analysis was performed
of the RXTE data and archival ASCA data. The deduced value of
is consistent with
the measured
spectrum of extended radio emission in A2319. Identification of the
power-law emission as Compton scattering of the radio-emitting electrons
by the CMB resulted in Brx ~ 0.1-0.3 µG,
and ~ 4 × 10-14 (R / 2 Mpc)-3 erg
cm-3 for the mean energy density of the emitting electrons in
the central region (radius R) of the cluster.
A 2256: Following a very short ~ 30 ks
observation of
A 2256 (in 1997) - which resulted in an upper limit
on NT emission
(Henriksen
1999)
- the cluster was observed (in 2001 and 2002) for a
total of ~ 343 ks (PCA) and ~ 88 ks (HEXTE). The data analysis
(Rephaeli
& Gruber 2003)
yielded evidence for two
components in the spectrum. Based on statistical likelihood alone the
secondary component can be either thermal or power-law. Joint analysis
of the RXTE and archival ASCA data sets yielded
kT1 =
7.9-0.2+0.5 and kT2 =
1.5-0.4+1.0, when the second
component is also thermal, and kT =
7.7-0.4+0.3 and
=
2.2-0.3+0.9 (90% CL), if the second component
is a power-law. Identifying the secondary emission as due to Compton
scattering of the radio producing relativistic electrons yielded
Brx
0.2-0.1+1.0 µG in the central 1°
region of the cluster, a region which contains both the halo and relic
sources.
A 2163: The moderately-distant (z = 0.203) cluster was observed for ~ 530 ks (during a 6 month period in 2004). Primary thermal emission in this cluster comes from very hot IC gas with kT ~ 15 keV, but analysis of the observations (Rephaeli et al. 2006) indicated very clearly that this component does not by itself provide the best fitting model. A secondary emission component was needed, and while this could also be thermal at a temperature significantly lower than 15 keV, the best fit to the full dataset was obtained with a power law secondary spectral component. The parameters of the NT emission imply a significant fractional flux amounting to ~ 25 % of the integrated 3-50 keV emission. NT emission is expected given the intense level of radio emission, most prominently from a large radio halo. Rephaeli et al. (2006) assumed that the NT emission originates in Compton scattering of (the radio-emitting) relativistic electrons by the CMB, and estimated Brx ~ 0.4 ± 0.2 µG to be an overall mean field strength in the large complex region of radio emission in the cluster.
A 3667: The cluster was observed (in 2001 and 2002) for ~ 141 ks; analysis of the RXTE observation and lower energy ASCA data, yielded only marginal evidence for a secondary power-law emission component in the spectrum (Rephaeli & Gruber 2004). This resulted in an upper limit of 2.6 × 10⁻¹² erg cm-2 s-1 (at 90% CL) on NT emission in the 15-35 keV band. When combined with the measured radio flux and spectral index of the dominant region of extended radio emission, this limit implies a lower limit of ~ 0.4 µG on the mean, volume-averaged magnetic field in A 3667.
1ES 0657-55.8: At z = 0.296 the `bullet' cluster is the most distant cluster searched for NT emission with RXTE. The cluster was observed (in 2002 and 2003) for a total of ~ 400 ks. Joint analysis of the RXTE observations together with archival XMM-Newton observations clearly indicated the presence of a second spectral component (Petrosian et al. 2006). While the nature of this second component cannot be determined from the spectral analysis alone, the authors argue that a power-law spectral shape is a more viable interpretation than an exponential. Since no radio data were available, the authors could only determine a mean field value of ~ 1.2 µG assuming energy equipartition between the field and relativistic electrons.
3.4. Search for NT emission with BeppoSAX
For observations of clusters the two relevant instruments were the MECS and PDS, the former with a spectral range of 1.3-10 keV, 56' FOV and ~ 2' resolution, and the latter with response in the nominal 15-300 keV range and 1.3° FOV. The capability to separate the respective contributions of low and high energy components requires simultaneous and self-consistent measurements. For this reason the lack of spectral overlap of the two instruments (and their somewhat different FOV) was unfortunate.
3.4.1. Observations of Individual Clusters
Results of searches for cluster hard X-ray emission are summarised in Table 2; a brief discussion of these results follows.
Coma:
Fusco-Femiano
et al. (1999)
reported a 4.5 detection of excess emission above the primary thermal emission in ~
91 ks PDS observations carried out in 1997, but a later re-analysis
resulted in a reduced estimate of the significance to
3.4
(Fusco-Femiano et al. 2004).
The cluster was observed again
for ~ 300 ks (in 2000), and an analysis of the combined datasets
- with a thermal component whose temperature was assumed to be
kT = 8.1 keV - yielded a
4.8 detection of excess
emission in the 20-80 keV band
(Fusco-Femiano
et al. 2004).
Assuming a power-law form for this excess emission with index
~ 2.0, the 20-80
keV flux of 1.5 ± 0.5 × 10⁻¹¹ erg s-1
cm-2 was derived (a value which is consistent with that
derived by
Nevalainen
et al. (2004).
Interpreting this to be of Compton origin, and using the radio
flux, resulted in Brx ~ 0.2 µG.
detection of excess emission above the primary thermal emission in ~
91 ks PDS observations carried out in 1997, but a later re-analysis
resulted in a reduced estimate of the significance to
3.4
(Fusco-Femiano et al. 2004).
The cluster was observed again
for ~ 300 ks (in 2000), and an analysis of the combined datasets
- with a thermal component whose temperature was assumed to be
kT = 8.1 keV - yielded a
4.8 detection of excess
emission in the 20-80 keV band
(Fusco-Femiano
et al. 2004).
Assuming a power-law form for this excess emission with index
~ 2.0, the 20-80
keV flux of 1.5 ± 0.5 × 10⁻¹¹ erg s-1
cm-2 was derived (a value which is consistent with that
derived by
Nevalainen
et al. (2004).
Interpreting this to be of Compton origin, and using the radio
flux, resulted in Brx ~ 0.2 µG.
Rossetti &
Molendi (2004)
questioned the reliability of the Fusco-Femiano et al.
(1999,
2004)
analyses. Having carried out their own analysis of 69
blank fields observed with PDS, they found that the two offset positions
used for the local background determination yielded systematically
different results for the background-subtracted flux. Since
Fusco-Femiano et al.
(1999,
2004)
used only one offset pointing (due to contamination in the other offset
field), without any adjustment for the systematic difference,
Rossetti &
Molendi (2004)
claimed that the results of Fusco-Femiano et al. are incorrect. Based on
the use of a different software package (SAXDAS) for background
determination,
Rossetti &
Molendi (2004)
determined that the significance of detection of excess
emission in the original observation was only at the
2 level,
while their analysis of the second observation yielded no evidence for
excess emission, in strong contrast with the
4.8 detection level
deduced by
Fusco-Femiano
et al. (2004).
The analysis was repeated (see Fig. 2) by
Fusco-Femiano
et al. (2007);
they concluded
that the discrepant results are due to the presence of two variable
sources in one of the background fields, which is why they ignored that
field in their analysis. The different background fields and the use of
the XAS software (rather than SAXDAS) were suggested to be the reasons
for the high significance
(4.8) detection reported by
Fusco-Femiano
et al. (2004).
In a recent reply to
Fusco-Femiano
et al. (2007),
Rossetti &
Molendi (2007)
defended their
re-analysis and the lower detection significance of the hard excess,
re-emphasising that the significance is highly sensitive to both the
choice of the offset pointings for local background estimation, and also
to the exact value of the temperature adopted in the analysis.
Landi (2005)
analysed a sample of 868 blank fields and found no difference in flux
values when using either of the two offset pointings. However,
Rossetti &
Molendi (2007)
could not investigate the reasons for the discrepancy between their
blank sky measurements and those of
Landi (2005)
since the details of the latter work are not yet publicly available.
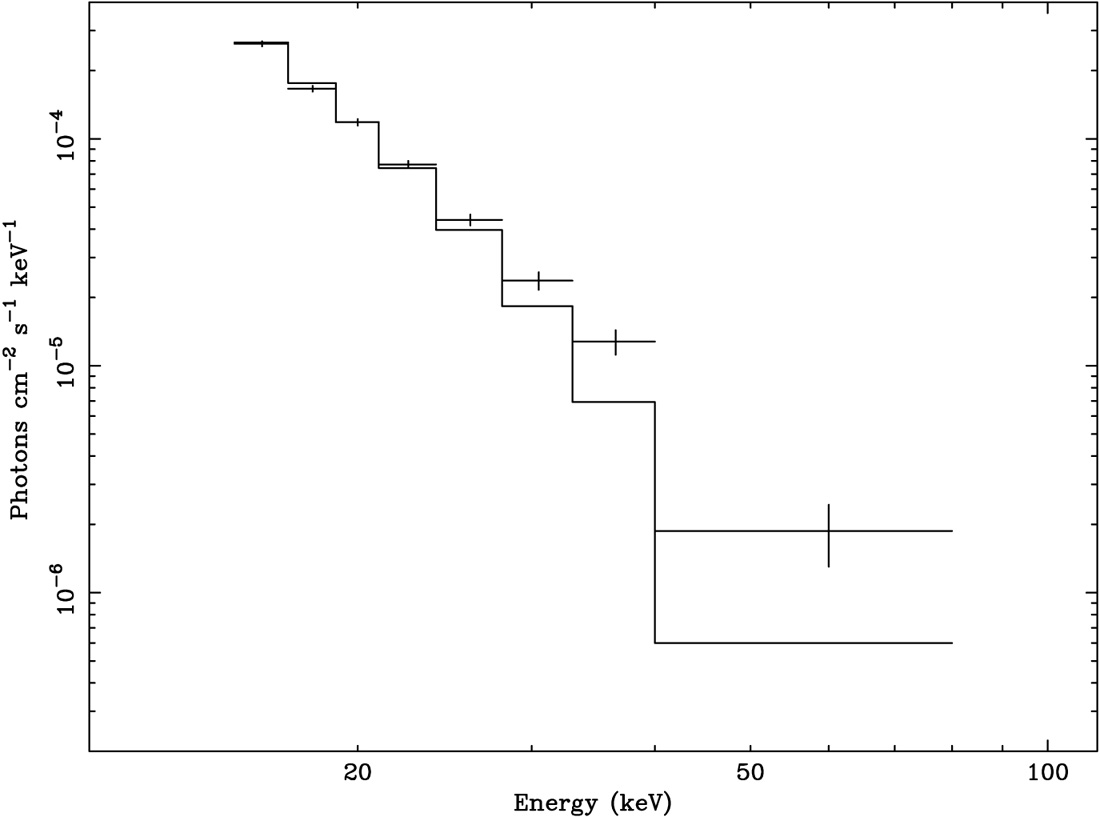 |
Figure 2. BeppoSAX spectrum of the Coma cluster obtained using the XAS software package (from Fusco-Femiano et al. 2007). Data are from PDS measurements (above 15 keV, with 68% error bars); the line is a best-fit thermal model with kT = 8.11 keV obtained previously from Ginga measurements (David et al. 1993). |
Flux confusion due to unidentified (and therefore unremoved) background AGN is particularly troublesome due to the relatively large FOV (1.3°) of the PDS. Although some of the integrated emission of distant AGN in the cluster field is removed in the rocking mode, there still is a residual signal due to AGN background fluctuations, and possibly also the presence of AGN in the cluster. This introduces a level of systematic uncertainty that was not specifically accounted for in most published PDS cluster analyses. Analysing 164 PDS blank-sky observations, Nevalainen et al. (2004) found a systematic difference in the background-subtracted fluxes when using only one of the two pointings available for the local background estimate in the standard rocking mode. The authors speculate that this might be due to either radiation entering the collimators from the side, screening of the instruments by the satellite, or the fact that the detector is looking at more/less radioactive parts of the satellite. These results are qualitatively similar to those of Rossetti & Molendi (2004), but are more pronounced by a factor of ~ 2. The difference in flux values when using either of the two offset pointings seems to be the reason for the different results obtained for the significance of the detection of NT emission in Coma. The issue remains unsettled and needs to be further explored.
Moreover, as we have pointed out, precise separation between the primary and secondary spectral components depends very much on the ability to do a simultaneous fit to the parameters of both thermal and possibly NT emission. The search for a NT component with BeppoSAX suffered from lack of spectral overlap between the MECS and PDS instruments, and consequently the need to adopt a previously determined value of kT. Due to inherent differences between the HEXTE and PDS instruments, only a rough comparison between the respective results can be made. In this spirit it is apparent that the two estimates for the NT (20-80 keV) flux (Rephaeli & Gruber 2002, Fusco-Femiano et al. 2004) are in agreement (see Tables 1 & 2).
A 2256:
Fusco-Femiano
et al. (2005)
analysed two separate PDS observations of the cluster for a total of ~
430 ks; they claimed a
4.8 detection of excess
emission. Fitting this excess to a power-law yielded
=
1.5-1.2+0.3 and a 20-80 keV flux of
8.9 × 10⁻¹² erg cm-2 s-1, which is
essentially the same value deduced by
Nevalainen
et al. (2004).
Use of the measured radio flux yielded Brx ~ 0.05
µG, assuming that the NT emission they deduced originates in
the radio relic located in the NW side of the cluster. We note that the
flux deduced by
Rephaeli &
Gruber (2003)
is about a factor of ~ 2 lower than that of
Fusco-Femiano
et al. (2005),
but given the large uncertainty in
, for which the
former authors quote a relatively low value, this difference is not very
significant.
A 2199: Analysis of MECS 8-10 keV measurements led Kaastra et al. (1999) to claim detection of a significant excess emission (over that of the best-fit thermal model). Fit of a power-law to the data yielded an index of 1.81 ± 0.25. They concluded that this emission originates in an outer region (beyond a 300 kpc central radial region), and that its relative strength (with respect to thermal emission) increases such that it dominates the 8-10 keV emission at ~ 1 Mpc from the centre.
| Cluster | 20-80 keV flux | |
Brx | Reference |
| (10-12 erg s-1 cm-2) | (µG) | |||
| Coma a | 15 ± 5 | ? | 0.2 | Fusco-Femiano et al. (2004) |
| A 2256 | 8.9-3.6+4.0 | 1.5-1.2+0.3 | 0.05 | Fusco-Femiano et al. (2000) |
| A 2199 | 9.8 ± 4.0 | 1.8 ± 0.4 | ? | Kaastra et al. (1999) |
| A 2319 | 23 |
? | 0.04 |
Molendi et al. (1999) |
| A 3667 b | 6.4 |
2.1 | 0.4 |
Fusco-Femiano et al. (2001) |
| A 754 c | ~ 2 | ? | 0.1 | Fusco-Femiano et al. (2003) |
| Centaurus d | 10.2 ± 4.6 | 1.5-1.3+2.3 | Molendi et al. (2002) | |
| All quoted errors are at the 90% confidence level. | ||||
| a According to Rosetti & Molendi (2007) proper accounting for uncertainties makes the detection insignificant. | ||||
| b The emission from AGN FRL 339 was not subtracted out. | ||||
| c The measured flux is possibly from the radio galaxy 26W20. | ||||
| d The measured flux is possibly due to an AGN. | ||||
A 3667: A marginal detection (at a
2.6 significance)
of excess 20-35 keV emission was reported by
Fusco-Femiano
et al. (2001).
A power-law fit resulted in an index of ~ 2.1, from which an upper
limit on NT 20-80 keV flux of 6.4 × 10⁻¹²
erg s-1 cm-2, and a lower limit
Brx
0.4 µG
were deduced. However, the authors did not consider the impact of the
presence of the Seyfert 1 galaxy FRL 339 in the PDS FOV; emission from
this galaxy is at a level comparable to that attributed to the NT
component
(Nevalainen
et al. 2004).
This would seem indeed the case, given the fact that analysis of
RXTE measurements yielded only an upper limit on NT emission
(Rephaeli
& Gruber 2004).
A 754:
Fusco-Femiano
et al. (2003)
reported the detection of excess emission above 45 keV at a
3.2 significance. They
deduced a 10-40 keV flux of 2 × 10-12 erg
s-1 cm-2 and Brx
0.1 µG, but
noted that the presumed NT emission could possibly be from the radio
galaxy 26W20.
Centaurus:
Molendi et
al. (2002)
detected a hard X-ray excess at the
3.6 level. The best-fit
power-law model yielded an index
of =
1.5-0.8+1.4, and a 20-200 keV flux of 2.2 ×
10-11 erg s-1 cm-2, but they concluded
that the emission may originate in a serendipitous AGN.
A 2319: No statistically significant power-law emission was detected in the analysis of a very short ~ 20 ks (PDS) observation, resulting in an upper limit of 2 × 10-11 erg s-1 cm-2, and a lower limit Brx ~ 0.04 µG (Molendi et al. 1999). As discussed above, the much longer (~ 160 ks) RXTE observation led to a significant NT flux.
3.4.2. Statistical results from a cluster sample
An attempt to obtain some insight from co-added PDS data on a sample of 27 clusters was made by Nevalainen et al. (2004). A brief review of their results follows.
The problematic aspects of a statistical study of PDS data should first be summarised. As we have already noted, flux confusion due to unidentified AGN is of particular concern due to the relatively large PDS FOV. Nevalainen et al. (2004) used optical catalogues to identify Seyfert 1 galaxies, and BeppoSAX MECS or ROSAT PSPC data at their locations to estimate the AGN contribution in the PDS spectra. Clusters for which the estimated Seyfert 1 contribution was more than 15% of the total signal were removed from the initial sample. Population synthesis modelling of the cosmic X-ray background (CXB) indicates that 80% of the AGN need to be obscured to produce the CXB spectrum (Gilli et al. 1999), which is harder than the spectrum of unobscured AGN. Indeed, recent deep X-ray observations of blank fields (e.g., Hasinger et al. 2001) have discovered a population of absorbed point sources that outnumbers the Seyfert 1 galaxies by a factor of ~ 4. These obscured AGN are seen through an absorbing torus (with NH = 1022 - 1025 atoms cm-2; Risaliti et al. 1999) which hides them in the soft X-ray band. Thus, a robust estimate for their contribution was not available. However, the spectral and spatial distribution of the NT emission (see below) argues against significant contamination due to obscured AGN in the final Nevalainen et al. (2004) sample.
The thermal emission of clusters in the sample was modelled by
Nevalainen
et al. (2004)
based on results of published analyses of the emission
measured by the BeppoSAX MECS and XMM-Newton EPIC instruments. Since the
PDS has no spatial resolution, the flux observed in the central region was
extrapolated to the full PDS FOV using the appropriate single (or double)
models,
after account was made for vignetting. They extrapolated
the thermal emission model to the 20-80 keV band and compared the
prediction with the PDS data, thus estimating the NT emission. The
comparison showed that in ~ 50% of the clusters the NT component
was marginally detected at the
2 level. Most of the
significant detections were found in clusters which show signs of recent
merger activity. Specifically, when clusters were divided into `relaxed' or
`merger' groups, it was determined that the mean 20-80 keV NT emission
in the latter group (4.8 × 10⁻²
counts s-1) was ~ 10 times higher than that of the `relaxed'
clusters (see Fig. 3). The level of
systematic uncertainties due to background fluctuations is such that
only the emission from clusters in the `merger' group was found to
be marginally significant (at ~
2). Assuming a power-law
shape for this excess with (photon) index of 2.0, it was deduced that
the 20-80 keV luminosity per cluster is 4 × 1043
h70-2 erg s-1
(Nevalainen
et al. 2004).
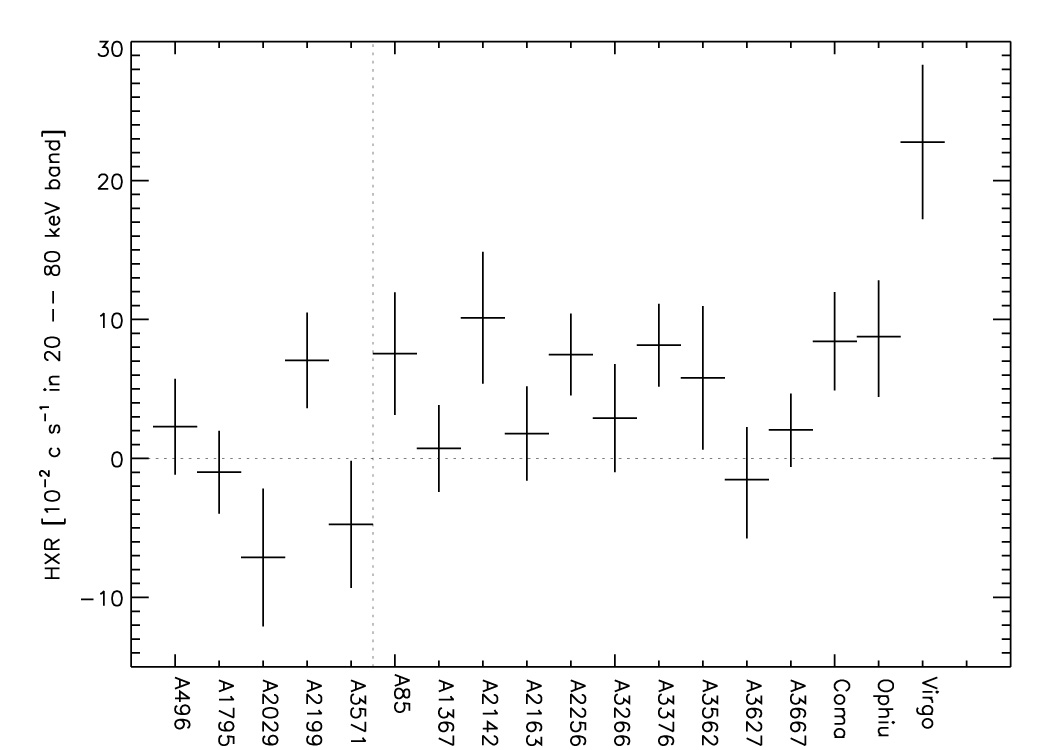 |
Figure 3. NT signal and
1 |
The residual emission of the individual clusters was too weak for meaningful spectral analysis; therefore, Nevalainen et al. (2004) co-added the data for the clusters, which amounted to a total of 560 ks. In order to obtain an estimate for the thermal contribution, the authors fitted data in the 12-20 keV band obtaining a best-fit temperature of ~ 8 keV, consistent with the sample median. Extrapolating this model to the 20-80 keV band showed that there was indeed excess emission (see Fig. 4). A fit of the full 12-115 keV data to a thermal model resulted in a statistically unacceptable fit with an unrealistically high temperature of ~ 26 keV.
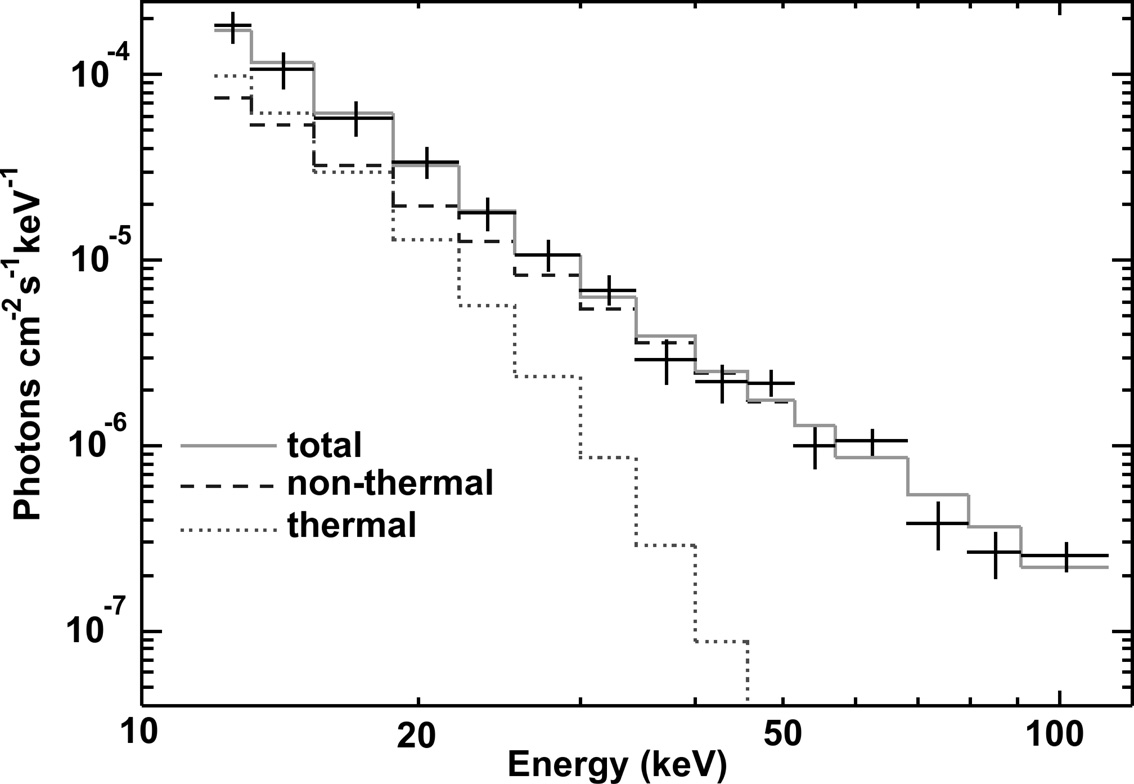 |
Figure 4. The combined PDS spectrum of all
the clusters not significantly affected by AGN
(Nevalainen
et al. 2004).
Lines show the unfolded model components while crosses show the data
and 1 |
A fit of the residual emission with a power-law model yielded a best-fit
index =
2.8-0.4+0.3 at 90% CL. Since a typical
AGN index is ~ 1.8, appreciable AGN emission was ruled out at
the 98 % CL. The high level of NT emission in the 12-20 keV band
(~ 50% of the total) is problematic, because in the central
regions of the clusters in which NT emission was deduced, the MECS
data typically allow the fractional contribution of such emission
to be only a few percent. This seems to suggest that NT emission is
extended with only a small fraction originating in the central region.
The indication from these statistical results for a connection between the cluster merger state and NT emission may be seen to support the scenario whereby electrons are accelerated by merger shocks. If so, the deduced power-law indices correspond to differential relativistic electron spectra with indices in the range µ = 3.8-5.0. The implied radio synchrotron (energy) spectral indices ~ 1.4-2, are consistent with the observed range.
3.5. Search for NT emission with ASCA
ASCA had a fairly good sensitivity and low background up to about 10 keV, clearly too low for observing cluster NT emission. But there could also be detectable NT emission in groups of galaxies, in which galaxy interactions occur at relatively high encounter rates, and given that gas temperatures in groups are typically about 2 keV or less, an attempt was made to look for NT emission with ASCA. The first reported detection of excess emission, at energies above 5 keV, was made for the group HCG 62 (Fukazawa et al. 2001). The luminosity of the excess component was ~ 4 × 1041 erg s-1, which was estimated to be some 20 times higher than the contribution of discrete X-ray sources. The hard excess was spatially extended to about 10' from the centre. Since the spectrum was too hard to be interpreted as thermal emission from the intra-group gas, a NT origin was thought to be more likely. A recent analysis of Suzaku XIS and HXD (see below) measurements of HCG 62 resulted only in an upper limit on NT emission (Tokoi et al. 2007), but at a level which does not exclude the ASCA result.
Nakazawa et
al. (2007)
carried out a search for NT emission from 18
groups of galaxies observed with ASCA, including HCG 62. They
fitted the spectra below 2.5 keV with 2 temperature thermal (MEKAL)
models and compared the data in the 4-8 keV band with the extrapolated
thermal spectra. Excess fluxes are shown in
Fig. 5 in terms of statistical significance.
HCG 62 and RGH 80 show excess emission at >
2 CL, with
excess emission thought to be likely also in NGC 1399. The residual
spectra could be fitted either with a thermal model with
kT 3
keV or a power-law model with photon index fixed at 2. The 2-10
keV luminosity of the excess component is 10-30% of the thermal
emission and 4-100 times stronger than the contribution from discrete
X-ray sources. They concluded that both thermal and NT origins
are acceptable from a statistical point of view.
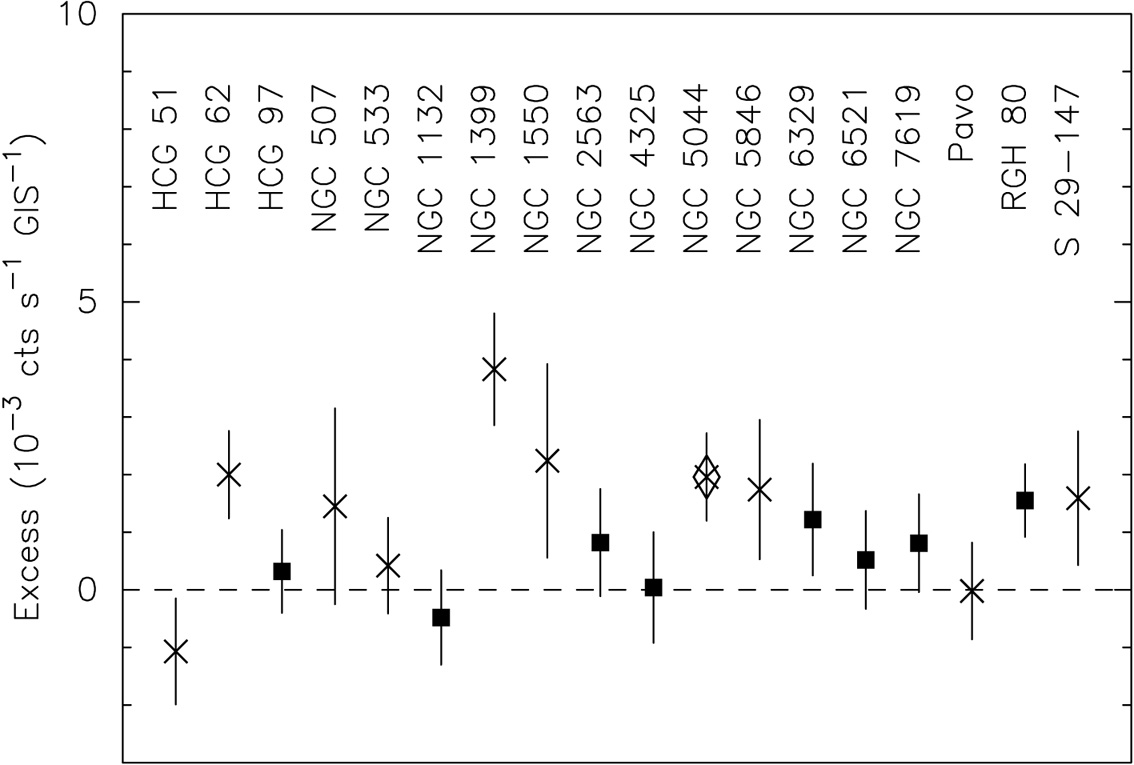 |
Figure 5. ASCA measurement of excess
emission in a sample of 18
groups of galaxies. The count rate in the 4-8 keV band is shown by
the residual over the thermal model determined in the energy range
below 2.5 keV. Squares denote groups for which
the soft-band spectrum was fitted with single temperature model, while
in the systems shown by stars two-temperature models were required.
Error bars include statistical and systematic
1 |
3.6. Search for NT emission with Suzaku
Suzaku, the 5th Japanese X-ray satellite launched in July 2005, carries
hard X-ray detectors (HXD) along with the X-ray CCD instrument (XIS).
The combined energy range is from 0.3 keV up to about 600 keV, and
a wide-band coverage of X-ray and
-ray
sources is possible. The HXD system consists of 16 units of well-type
phoswich detectors, surrounded by anti-coincidence shield scintillators
(Takahashi et
al. 2007,
Kokubun et
al. 2007).
The well-type detector consists of a long active collimator made of BGO
(a Bismuth-Germanium Oxyde), and the bottom of the well is equipped
with Si PIN detectors and a GSO (a Gadolinium-Silicon Oxyde)
scintillator. The PIN is 2 mm thick
and sensitive from 8 keV to 50 keV; the GSO covers the 50-600 keV
band. Typical effective areas are 160 cm2 at 10 keV (PIN), and
330 cm2 at 100 keV (GSO). The FOV is 34' × 34' FWHM
below 100 keV, limited by a phosphor bronze fine collimator installed in
the well.
At higher energies, the FOV becomes wider, up to 4.5° ×
4.5°. The PIN detectors are cooled to -20°C by a thermal
radiator connected with heat pipes.
The background level is very low for the PIN detector, since it has no accumulated effect of radio-activation in orbit. The measured background level in orbit is indeed lower than the level of the PDS (on BeppoSAX) by a factor of about 3, even though Suzaku's inclined orbit makes it more susceptible to the intense X-rays during passage through the radiation belt. This and the HXD narrow FOV make it the most sensitive instrument in the 10-60 keV band, among all previously flown hard X-ray detectors.
About 30 clusters have already been observed (as of April 2007) with Suzaku, including several for which the primary purpose is a search for NT emission. Meaningful constraints on NT emission were obtained for rather low temperature clusters. Most extensively observed is A 3376; these observations are described in some detail.
A 3376: This nearby (z = 0.046)
merging cluster has an IC gas
temperature of ~ 4 keV. The relatively low temperature motivated
the selection of the cluster as the prime target for observations with
the PIN detectors. The cluster is noted by two large radio relics,
probably expanding over a Mpc scale in the east and west boundaries of
the thermal emission. BeppoSAX observations resulted in a
2.7
detection of a NT component. The Suzaku observations were carried out
during two separate pointings in October and November 2005. The first
~ 90 ks observation covered the central region which includes
the east relic, and the second ~ 103 ks was centred on the west relic
region.
The background properties have been investigated by
Kawano et
al. (2007)
and applied to the A 3376 data. Background data, i.e. data taken when
the satellite was pointing to the dark Earth, were sorted by position of
the satellite in Earth coordinates. This basically performs sorting with
the cosmic-ray cut-off rigidity which is known to correlate well with the
non X-ray background. Since passage through the radiation belt leaves
enhanced emission afterward, the data in each Earth position were
further divided into northward and southward satellite movements. The
long-term trend of the background variation was also included in the
estimation. Comparison with the predicted background rate and the
observed dark Earth data indicates that this method gives 3.5%
(1) error.
This method was applied to the observed data in the energy range 15-50 keV. Thermal cluster emission, estimated from the XIS measurements, CXB and point source contributions need to be subtracted. As shown in Fig. 6, the HXD PIN spectrum for the west relic suggests some level of excess emission. Including fluctuations of all these components, the flux of the west relic in the 15-50 keV band is (6.3 ± 1.8 ± 6.2) × 10-12 erg cm-2 s-1, where the errors are statistical and systematic, respectively. Most of the systematic error, about 85%, is non-CXB; thus, further improvement in the background estimation is necessary in order to better determine the level of excess emission. The implied upper limit, 1.4 × 10⁻¹¹ erg cm-2 s-1, is consistent with the limit obtained from the RXTE measurements, and about 20% lower than the level reported from the BeppoSAX observation.
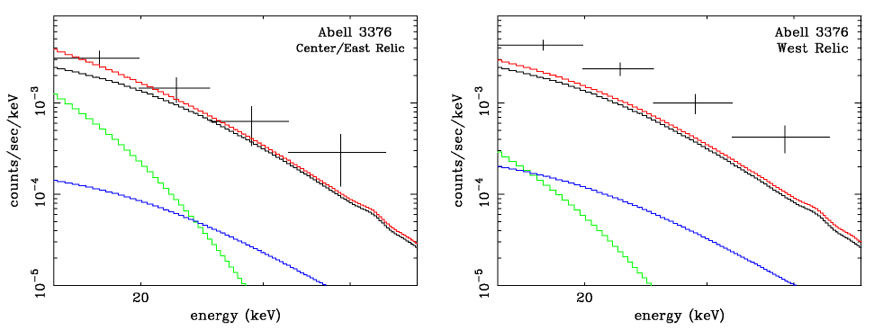 |
Figure 6. Background subtracted spectra of A 3376 with the Suzaku HXD PIN detector (Kawano et al. 2007). Left panel is for the region including the centre and the east relic; the right panel is for the west relic. Upward along the left-hand ordinate, the four solid curves show estimated flux due to point-sources, cluster thermal emission, cosmic X-ray background contribution, and their sum, respectively. |
The west-relic region was jointly observed with the XIS instrument, and Kawano et al. also constrained the possible power-law flux based on the spectral fit. The obtained upper limit in the 4-8 keV region is extrapolated to 15-50 keV assuming a photon index of 1.8 with no scaling with the FOV, and it corresponds to about 20% of the hard X-ray upper limit. Of course, it is quite possible that the true NT flux is less than 3 × 10-12 erg cm-2 s-1 in the 15-50 keV band; however, if the emission is spatially extended then the XIS constraint still allows a hard flux of 2.4 × 10⁻¹¹ erg cm-2 s-1 over the PIN field of view. Thus, an extended hard X-ray emission (larger than 0.5°) remains a possibility. Using the 1.4 GHz measurement of the west relic, Kawano et al. deduced a lower limit Brx > 0.1 µG.
A 1060 and the Centaurus cluster:
These clusters are both relaxed nearby systems with kT ~ 3.5 keV; A 1060 is non-cD
cluster, while the Centaurus cluster is dominated by a cD galaxy. The
clusters were well studied by
Kitaguchi et
al. (2007).
The observed
data for the A 1060 and Centaurus cluster by the PIN instrument
were accumulated for 28 and 26 ks, respectively. The latter authors
applied the standard non-CXB subtraction and found that the blank-sky
data yielded a fluctuation of 3-5%
(1) in the energy range
10-50 keV. When the non-CXB flux was subtracted from the data,
the data for both clusters showed agreement with the CXB above 20
keV; the A 1060 data even showed a deficit of the counts. In
the energy
range 10-20 keV, there remained an excess flux over the CXB
level for both clusters. The flux was 4 or 8 times stronger than the
CXB level for A 1060 and Centaurus, respectively. The cluster thermal
emission was measured with ASCA, which had a wider FOV than the PIN,
and the measured temperatures were 3.3 and 3.8 keV for the two clusters.
These spectra with the intensity consistent with the ASCA
measurement were compared with the PIN residual component. They found
that the thermal emission can explain the PIN data quite well for both
clusters, so only upper limits were derived on the NT emission.
3.7. INTEGRAL observation of the Coma cluster
A large fully coded field of view ( 8° × 8°), and
good imaging capabilities with a PSF of 12' FWHM, make it possible to
construct hard X-ray cluster images below 300 keV with the IBIS/ISGRI
coded mask instrument
(Ubertini et
al. 2003,
Lebrun et
al. 2003)
aboard the International Gamma-Ray Astrophysics Laboratory
(INTEGRAL,
Winkler et
al. 2003).
Renaud et
al. (2006)
reported the analysis of a ~ 500 ks observation of the Coma cluster with
IBIS/ISGRI. The cluster was detected at a significance ~
10 CL in the
18-30 keV energy band. The ISGRI image shows extended emission structure
globally similar to that is seen by XMM-Newton below 10 keV (e.g.
Arnaud et
al. 2001,
Neumann et
al. 2003).
In Fig. 7 we present
two images of the Coma field in the 18-30 keV (left panel) and 30-50 keV
(right panel) energy bands processed with the OSA-5 software, following a
procedure similar to that described in
Renaud et
al. (2006),
but for a longer (accumulated) ISGRI exposure of ~ 940 ks (`good
time'). The detected flux in the 18-30 keV band is consistent with the
extrapolation of the flux measured by XMM-Newton below 10 keV
assuming a model of a thin thermal plasma model with kT =
8 keV (see
Renaud et
al. 2006,
Eckert et
al. 2007);
no statistically significant flux is seen in
the higher energy band. From the observed images it appears that in
order to detect or meaningfully constrain with INTEGRAL the
presence of a NT X-ray component reported in RXTE and
BeppoSAX observations of Coma, an integration time longer by a
factor of ~ 2-3 would be required.
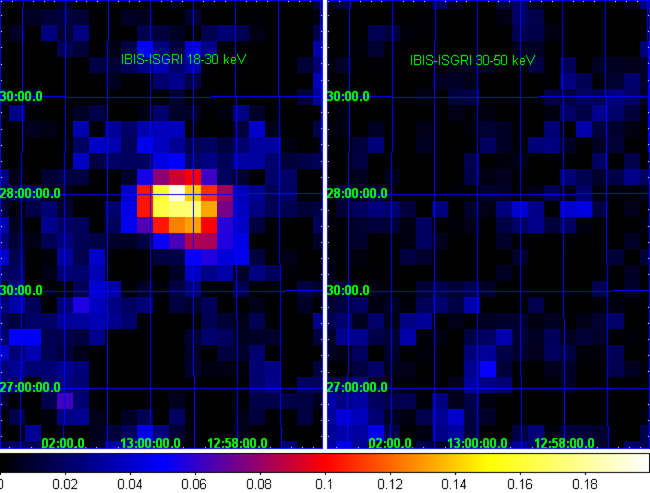 |
Figure 7. Hard X-ray images of the Coma cluster from a 940 ks IBIS-ISGRI observation. The left and right panels show the ISGRI mosaics in the 18-30 keV, and 30-50 keV bands, respectively. |
3.8. Limits on cluster
-ray
emission
The relatively steep power-law shape of cluster NT emission (which is
most precisely measured in the radio) directly implies that the detection
of -ray
emission from even nearby clusters will be very
challenging. To estimate the predicted level of emission, consider
the Coma cluster as an example; assuming no change in
the relativistic
electron power-law index, and the deduced 20-80 keV flux level (in
Table 1), the cumulative flux at
100 MeV is ~ 6 ×
10-9 cm-2 s-1. Although
substantially uncertain, flux at this level is close to the projected
GLAST sensitivity threshold for an exposure time of 1 yr for the
all sky survey. The flux will be well below this level if the electron
spectrum steepens even modestly at energies above the range deduced from
radio measurements. Note that
-ray
emission could also have hadronic origin (from
 0 decay, following
proton-proton interactions),
but only very rough limits can be placed on this emission (e.g.,
Dermer &
Rephaeli 1988).
0 decay, following
proton-proton interactions),
but only very rough limits can be placed on this emission (e.g.,
Dermer &
Rephaeli 1988).
A statistical upper limit on
-ray
emission from clusters was obtained by
Reimer et
al. (2003)
from analysis of EGRET
measurements. The emission in fields centred at 58 clusters
observed between 1991 and 2000 was analysed. A co-added mean flux
level was determined after accounting for the diffuse background
contribution. The resulting upper
2 limit on the mean cluster
flux above (photon) energy of
100 MeV was found to be
6 × 10⁻⁹ cm-2 s-1. Interestingly,
this level is at the level predicted for Coma based on direct
extrapolation of the deduced 20-80 keV flux. This EGRET upper
limit was used by
Bykov et
al. (2000)
and
Petrosian
(2001)
to constrain models of hard X-ray emission components of leptonic
origin; similarly
Blasi &
Colafrancesco (1999)
used it to constrain the energetic proton energy density in IC space.