


5.1. Lopsidedness in galaxies in groups
Tidal encounters between galaxies in groups are more probable given the higher number density and the consequent frequent interaction between galaxies in groups. Further, these have relative velocities similar to the field galaxies, hence the lopsidedness arising due to a response triggered by tidal encounters is more likely to occur in these. This is in fact borne out by the observations of Hickson group galaxies (Rubin et al. 1991) where a large fraction (> 50%) of galaxies show lopsided rotation curves. This is much higher than the case of field spiral galaxies where only ~ 25% show asymmetric rotation curves (Rubin et al. 1999, Sofue & Rubin 2001). The observation of rotation curves of 30 galaxies in 20 Hickson groups (Nishiura et al. 2000) confirms this higher frequency. In another study involving HI observations, all the five major spirals in the nearby Sculptor group of galaxies (Schoenmakers 1999) show kinematical lopsidedness, and two show morphological elongation or asymmetry. A multi-wavelength study of two group galaxies NGC 1961 and NGC 2276 shows evidence for lopsidedness which has been attributed to tidal interactions (Davis et al. 1997).
The two-dimensional maps of HI have been Fourier-analyzed recently to obtain the m = 1 Fourier amplitudes and phases for a sample of 18 galaxies in the Eridanus group (Angiras et al. 2006). This is the first quantitative analysis of asymmetry in the surface density distribution of the HI gas, and is similar to the Fourier analysis now done routinely in the literature for the near-IR data representing old stars in galaxies.
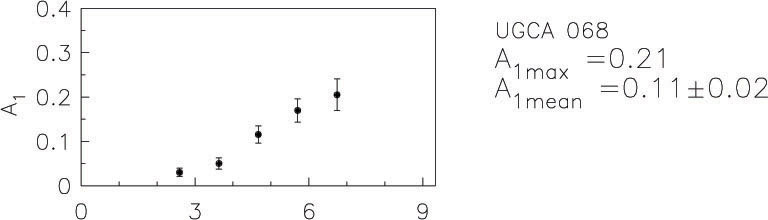
The group location of this sample allows us to serendipitously study the lopsidedness in a group setting. The galaxies studied show a higher magnitude of asymmetry than the field galaxies, and also a higher fraction of galaxies show asymmetry. The average amplitude of lopsidedness measured for the Eridanus group galaxies is nearly twice that in the field galaxies over the same radial range of 1.5-2.5 disk scalelengths. Second, nearly 30% of the sample galaxies show lopsidedness amplitudes three times larger than the field average of 0.1. Fig. 24 shows the results for two galaxies UGC 068 and NGC 1325, in the Eridanus group.
 |
 |
 |
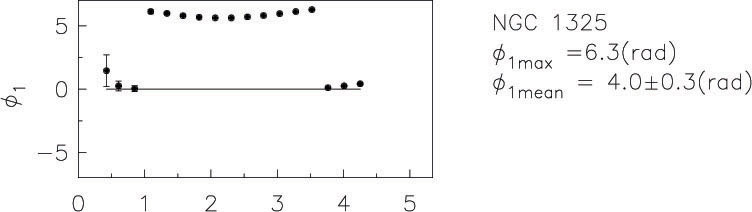 |
Figure 24. The lopsided amplitude and phase of the HI surface density distribution versus radius for the two galaxies UGC 068 and NGC 1325 in the Eridanus group, taken from Angiras et al. (2006). The amplitude increases with radius and the phase is nearly constant indicating that m = 1 is a global mode. The lopsidedness in the HI can be measured until several disk scalelengths, more than twice the radial distance possible for the stars. |
|
The asymmetry is measured in this case to over twice the radial distance that is typically covered in the near-IR studies (e.g. Bournaud et al. 2005b). This is because the tracer used here is HI which extends farther out than the stars, and because the sky background limits the Fourier analysis in the near-IR to ~ 2.5 disk scalelengths.
The A1 values measured from the HI data and the R-band data are available for four galaxies, and these were compared. It was found that in the radial region of overlap, the two tracers show a similar value of lopsidedness, see Fig. 25. This confirms that the origin of lopsidedness in HI is of a dynamical origin and not purely of a gas-dynamical process that only applies to the gas.
 |
 |
Figure 25. A comparison of the lopsided amplitude A1 obtained by analyzing the HI data and the R-band data for stars for NGC 1953 (left panel) and NGC 1359 (right panel), from Angiras et al. (2006). In the radial region of overlap the values are comparable, thus indicating the same origin for the lopsidedness both in stars and gas. The figures also strikingly illustrate that HI is a much better tracer than stars for the study of lopsidedness at large radii. |
|
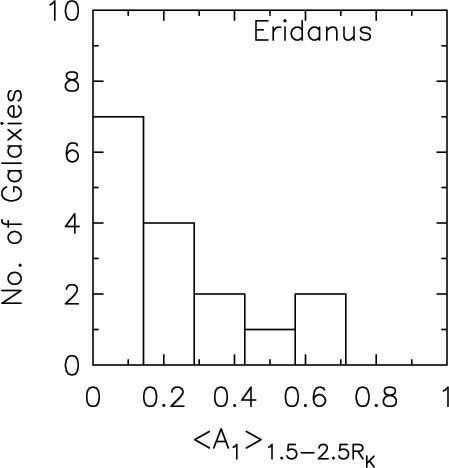
A similar Fourier analysis has been done for a sample of 12 galaxies in the Ursa Major (Angiras et al. 2007) by analyzing the 2-D HI data (Verheijen 1997) available for these. The average value of lopsided amplitude in the 1.5-2.5 disk scalelength region in this sample is smaller than in the Eridanus group, and is closer to the field galaxies case, as shown in Fig. 26. This could reflect the different spatial distribution of galaxies in the two groups - the ones in the Ursa Major are distributed along a filament.
 |
 |
Figure 26. The histograms denoting the number of galaxies vs. the lopsided amplitude measured in the 1.5-2.5 disk scalelength range for the Ursa Major Group (left) and the Eridanus group (right) of galaxies, taken from Angiras et al. (2007). The galaxies are more lopsided in the Eridanus group, indicating a substantial variation between groups. |
|
An interesting characteristic of lopsidedness in group galaxies as noted by Angiras et al. (2006) is that the early-type galaxies show a higher quantitative lopsidedness than do the late-type galaxies, see Fig. 27. This is opposite to what is seen in the field galaxies (Bournaud et al. 2005b) and indicates that tidal interactions play a dominant role in generating lopsidedness in the group galaxies. This is not surprising given the high concentration of galaxies in a group. Tidal interactions would tend to cause a secular evolution of galaxies to an earlier type and hence when these are the dominant mechanism for generating lopsidedness, one would expect higher values of lopsidedness for early-type galaxies, as argued by Bournaud et al. (2005b).
 |
Figure 27. The lopsided amplitude measured between the radial range of 1.5-2.5 disk scalelengths vs. the galaxy type, from Angiras et al. (2006). The early-type galaxies show a higher lopsidedness than the late-type galaxies. This is opposite of what is seen for the field galaxies, see Fig. 5. |
A distinguishing feature of asymmetry in the group galaxies is that
the values of the asymmetry as measured by the mean fractional Fourier
amplitudes A1, A2 and A3 for the modes
m = 1,2 and 3 are found to be comparable
(Angiras et al. 2007).
Also, the derived perturbation potential parameters
 1,
2 and
3 are
found to be comparable. Although this last result depends on the model
used, it reinforces the similar result obtained for the Fourier
amplitudes which are directly observed and hence are model-independent
(Section 3.1.2). This is in
contrast to the field galaxies where A1 and A2 are
comparable and are generally stronger than A3 and the other
higher mode amplitudes
(Rix & Zaritsky 1995).
This indicates the importance of multiple, simultaneous
tidal interactions that can occur under the special conditions of a
group environment. This needs to be studied by future dynamical studies
including by N-body simulations.
Since tidal interactions are frequent, occurring on a timescale of <
~ 0.5 Mpc / 300 km s-1 ~ 3 Gyr, the long-term
maintenance of lopsidedness is not a problem in this environment.
1,
2 and
3 are
found to be comparable. Although this last result depends on the model
used, it reinforces the similar result obtained for the Fourier
amplitudes which are directly observed and hence are model-independent
(Section 3.1.2). This is in
contrast to the field galaxies where A1 and A2 are
comparable and are generally stronger than A3 and the other
higher mode amplitudes
(Rix & Zaritsky 1995).
This indicates the importance of multiple, simultaneous
tidal interactions that can occur under the special conditions of a
group environment. This needs to be studied by future dynamical studies
including by N-body simulations.
Since tidal interactions are frequent, occurring on a timescale of <
~ 0.5 Mpc / 300 km s-1 ~ 3 Gyr, the long-term
maintenance of lopsidedness is not a problem in this environment.
5.2. Lopsidedness in galaxies in clusters
The galaxies in clusters may undergo even more frequent encounters than in the groups because of the generally higher number density of galaxies. However the relative velocity between galaxies is higher in clusters and hence the encounters are weaker in strength. The accumulation of a large number of weak interactions has been called the galaxy harassment (Lake, Katz, & Moore 1998). The asymmetry in NGC 4252 including the smoothly varying HI velocity field along the tidal tail, has been attributed to this effect (Haynes, Giovanelli & Kent 2007). The amplitude of lopsidedness generated due to tidal encounters is expected to be weaker in this case because of the quick encounters. On the other hand, other dynamical processes such as asymmetry arising due to ram pressure may be specifically applicable in a group or a cluster setting. This may even be the dominant source of gas asymmetry in these and can affect the HI gas lying on the outer parts of a galactic disk. An interesting interplay of these various effects is possible as in NGC 4848 in the Coma cluster, which shows a lopsided distribution of the molecular gas (Vollmer et al. 2001). This has been explained by the interaction between the galactic gas, and the gas removed by ram pressure stripping around 4 × 10⁸ yr ago which is now falling back.
Since the cluster galaxies often show HI deficiency especially in the outer parts where lopsidedness is generally more common, this could be a potential problem with detecting lopsidedness in cluster galaxies.
Despite this, in some galaxies of groups and clusters, the gas alone in known to show a strong asymmetry - as in NGC 4647 (Young et al. 2006). This strong gas asymmetry has been frequently attributed to ram pressure stripping. However, the role of the gravitational potential asymmetry in lopsidedness cannot be neglected, even in these cases.
5.3. Lopsidedness in centers of advanced mergers
A fairly new regime that is just beginning to be explored is the asymmetry at the centers of advanced mergers of galaxies. A recent systematic study was done by Jog & Maybhate (2006), with a view to understand the mass asymmetry and the relaxation in the central regions of mergers.
Interactions and mergers of galaxies are known to be common and significantly affect their dynamics and evolution. The outer regions of merger remnants covering a distance of ~ few kpc to a few 10 kpc have been well-studied. These can be fit by an r1/4 profile (class I), an outer exponential (class II) or a no-fit profile (class III) (Chitre & Jog 2002), and the first two can be explained as arising due to equal-mass mergers (e.g., Barnes 1992) or unequal-mass mergers (Bournaud, Jog & Combes 2005a) respectively, while the third class corresponds to younger remnants. Despite its obvious importance for the evolution of the central regions, the luminosity distribution in the central regions of mergers was not studied systematically so far. A few mergers where this has been studied, such as NGC 3921 (Schweizer 1996), and Arp 163 (Chitre & Jog 2002), show wandering or meandering centres for the consecutive isophotes.
Jog & Maybhate (2006) chose a sample of 12 advanced mergers which showed signs of recent interaction such as tidal tails or loops but had a merged, common center and covered all three classes discussed above; and the angular size of the galaxy was sufficiently large to allow the Fourier analysis by dividing the image into a few radial bins. The sample was chosen so as to cover the three classes showing different remnant profiles as described above. The Ks band images from 2MASS were analyzed using the task ELLIPSE in STSDAS. The elliptical isophotes were fitted to galaxy images while allowing the center, ellipticity and the position angle to vary so as to get the best fit. Fig. 28 (top panel) shows the result for Arp 163. The isophotes are not concentric, instead the centers (X0, Y0) of consecutive isophotes show a wandering or sloshing behaviour, indicating an unrelaxed central region.
Another measure of asymmetry is the lopsidedness of the distribution, to obtain this a galaxy image was Fourier-analyzed with respect to a constant center and the amplitude A1 and the phase p1 of the m = 1 mode were plotted versus radius - as shown for Arp 163 in the lower panel of Fig. 28. During the Fourier analysis the center was kept fixed, for the reason as discussed in Section 2.1.2. The intensity and hence the mass distribution is highly lopsided with the fractional amplitude for the m = 1 mode of ~ 0.15 within the central 5 kpc.
 |
Figure 28. Central region of the merger Arp 163 - The top panel shows the centers of the isophotes vs. the semi-major axis: the centers show a sloshing pattern indicating an unrelaxed behaviour. The lower panel shows the Fourier amplitude A1 and the phase p1 vs. radius for the lopsided mode (m = 1): the lopsided amplitude is large and the phase fluctuates with radius. This is taken from Jog & Maybhate (2006). |
All the sample galaxies show strong sloshing and lopsidedness in the central regions. The asymmetry does not seem to significantly depend on the masses of progenitor galaxies - being similar for class I and II cases. However, it is higher for the mergers in early stages of relaxation (class III). The corresponding values especially for the central lopsidedness are found to be smaller by a factor of few for a control sample of non-merger galaxies. This confirms that the high central asymmetry in mergers is truly due to the merger history.
The ages of remnants are deduced to be ~ 1-2 Gyr as seen from the remnants with similar outer disturbed features in the N-body simulations of mergers (Bournaud et al. 2004), during which time these are likely to get chosen as our sample galaxies.
Thus the central asymmetry is long-lived, lasting for ~ 100 local dynamical timescales. Hence it can play an important role in the dynamical evolution of the central regions. First, it can help fuel the central AGN since it provides a means of outward transport of angular momentum. Second, it can lead to the secular growth of the bulges via the lopsided modes. These need to be studied in detail theoretically. Since this predicted evolution is due to the central asymmetry that is merger-driven, this process could be important in the hierarchical evolution of galaxies.