


The single star population synthesis models (Section 3.3) predict a rapid decline in FUV-V with increasing redshift (lookback time), while the binary models suggest no significant change. This stark contrast provides an important test.
GALEX is NASA's UV space telescope mission that can do just this.
It has sensitive FUV and NUV detectors and reaches passive (no star
formation) old populations (such as many elliptical galaxies) out to
z ~ 0.2
(Martin et al. 2005).
Its Deep Imaging Survey (DIS) is obtaining the UV images of tens of
galaxy clusters using
 20,000 seconds of
exposure. The UV upturn is found to be the strongest in the
brightest cluster elliptical galaxies (BCGs) and hence we have tried to
obtain accurate photometric data on the BCGs in our galaxy cluster sample.
Besides, a number of lower-redshift (z ~ 0.1) BCGs have been sampled
from the shallower Medium-deep Imaging Survey (MIS) as described in
Schawinski et al. (2007).
The UV photometry turned out to be very tricky because there are many
background UV sources that are not easily identifiable in shallow images.
The background confusion would easily cause underestimation on
the UV brightness. Occasionally, small foreground objects that are
invisible in the optical images contaminate the UV flux of our target
galaxy as well.
20,000 seconds of
exposure. The UV upturn is found to be the strongest in the
brightest cluster elliptical galaxies (BCGs) and hence we have tried to
obtain accurate photometric data on the BCGs in our galaxy cluster sample.
Besides, a number of lower-redshift (z ~ 0.1) BCGs have been sampled
from the shallower Medium-deep Imaging Survey (MIS) as described in
Schawinski et al. (2007).
The UV photometry turned out to be very tricky because there are many
background UV sources that are not easily identifiable in shallow images.
The background confusion would easily cause underestimation on
the UV brightness. Occasionally, small foreground objects that are
invisible in the optical images contaminate the UV flux of our target
galaxy as well.
From the up-to-date GALEX database,
Ree et al. (2007)
obtained the data for seven BCGs from DIS and five from MIS.
A small fraction of the BCGs had star formation signatures
(Yi et al. 2005)
and hence had to be removed from our sample.
Figure 3 shows the look-back time evolution of
the apparent (not K-corrected) FUV - V colour for
the BCGs at z < 0.2.
The FUV flux fades rapidly with redshift. The colours are derived from total
magnitudes to minimize aperture effect. Model lines are calibrated to
the colour range (FUV - V = 5.4 - 6.4) of the giant
elliptical galaxies in nearby clusters (open circles), and
passively evolved and redshifted
with look-back time so that they can be directly compared with the
observed data of the BCGs (filled circles)
in GALEX DIS (black) and MIS (grey) mode. The size of circle symbols
represents the absolute total luminosity in r-band. The solid and
dashed lines are from the passively evolving UV-to-optical spectra
of the "metal-poor" and "metal-rich" HB models
(Section 3).
The regions filled with oblique lines denote the predicted colour
range from these two extreme models. The dotted line indicates
the apparent colour expected when the local UV upturn galaxy NGC 1399
model spectrum is redshifted without the effect of stellar evolution.
The binary population models would be similar to the non-evolving model.
The higher redshift data points at 0.33 and 0.6 are the HST data from
Brown et al.
(2000,
2003)
The model fits by
Ree et al. (2007)
and
Lee et al. (2005a)
suggest that the GALEX data show a UV flux decline with
lookback time at the rate
 (FUV - V)
/t = 0.54
mag / Gyr.
Although a definite answer requires more data, the current sample
seems more consistent with the prediction from the single-star population
models. Any population model aiming to explain the UV upturn phenomenon
would be obliged to reproduce this unique data.
(FUV - V)
/t = 0.54
mag / Gyr.
Although a definite answer requires more data, the current sample
seems more consistent with the prediction from the single-star population
models. Any population model aiming to explain the UV upturn phenomenon
would be obliged to reproduce this unique data.
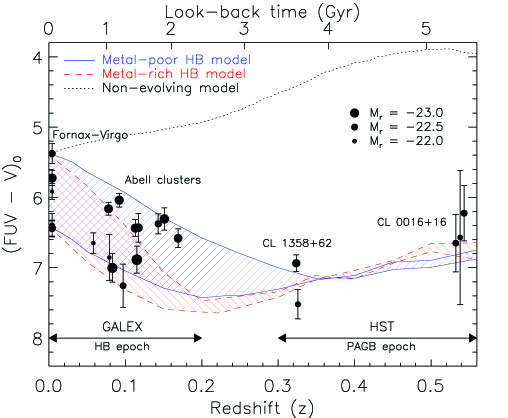 |
Figure 3. Look-back time evolution of the
apparent (not K-corrected) FUV - V
colour for the brightest cluster elliptical galaxies (BCGs) at z
|
 0.2.
FUV flux fades rapidly with redshift which is consistent with the
prediction from the single-star population models
(
0.2.
FUV flux fades rapidly with redshift which is consistent with the
prediction from the single-star population models
(