


Infrared observations have considerable advantages over optical observations of galaxies. While traditional B-band images are sensitive to dust and extinction (both internal and external), the effects of extinction in the near- and mid-IR are much less, and become virtually negligible at 3.6µm. Spiral galaxies imaged at wavelengths successively longer than B-band become progressively smoother-looking, not only due to the reduced effect of extinction, but also to the de-emphasis of the young blue stellar component. The combination of these effects has led to the popular idea that IR imaging reveals the "stellar backbone" of galaxies, i. e., the distribution of actual stellar mass (e. g., Rix & Rieke 1993; Block et al. 1994). Thus, infrared imaging has become a staple for studies of the gravitational potential and stellar mass distribution in galaxies (e. g., Quillen, Frogel, & González 1994), and for the quantification of bar strength from maximum relative gravitational torques (e.g., Buta & Block 2001; Laurikainen & Salo 2002).
Infrared imaging has also revealed interesting outer structures such as the large outer red arcs seen in M33, which have been interpreted by Block et al. (2004b) to be swaths of extremely luminous carbon stars formed from external accretion of low metallicity gas. Power spectrum analysis of the IR structures in classical spirals has been used to detect azimuthal "star streams" and to evaluate the role of turbulence on star formation and spiral structure (Block et al. 2009 and references therein).
Near-infrared imaging from 0.8-2.2µm can be successfully
obtained
from groundbased observatories but with the serious drawback that the
brightness of the sky background increases substantially over this
range. As a result, it has not been possible to achieve a depth of
exposure at, for example, 2.2µm comparable to the kinds of
depths achievable at optical wavelengths without excessive amounts of
observing time. The first major near-IR survey designed for
large-scale morphological studies was the Ohio State University Bright
Spiral Galaxy Survey (OSUBSGS,
Eskridge et al. 2002),
which included optical BVRI and near-IR JHK images of 205
bright galaxies of types
S0/a to Sm in a statistically well-defined sample selected to have
total blue magnitude BT
 12.0 and isophotal diameter
D25
6.'5. This survey allowed a
direct demonstration of how galaxy morphology actually changes from
optical to near-IR wavelengths, not merely for a small, selected sample of
galaxies, but for a large sample covering all spiral subtypes.
The main near-IR filter used in this survey was the H-band at
1.65µm.
12.0 and isophotal diameter
D25
6.'5. This survey allowed a
direct demonstration of how galaxy morphology actually changes from
optical to near-IR wavelengths, not merely for a small, selected sample of
galaxies, but for a large sample covering all spiral subtypes.
The main near-IR filter used in this survey was the H-band at
1.65µm.
The OSUBSGS was later complemented by the Near-Infrared S0 Survey
(NIRS0S,
Laurikainen et al. 2005,
2006,
2007,
2009,
2010;
Buta et al. 2006),
a Ks-band imaging survey of 174 early-type galaxies in the
type range S0- to Sa, but mostly including S0s, some of which
were misclassified as ellipticals in RC3. NIRS0S images are deeper than
OSUBSGS near-IR images owing to the use of larger telescopes and longer
on-source times. Although S0 galaxies are dominated by old stars and
are usually smooth even in blue light images, the Ks
band was chosen
to complement the OSUBSGS sample of spirals in order to make a fair
comparison between bar strengths and bulge properties of S0s and
spirals. Also, S0 galaxies are not necessarily dust-free, and near-IR
imaging is still necessary to penetrate what dust they have. NIRS0S has
led to several important findings about S0 galaxies: (1) a class of
S0s, not previously recognized, having prominent lenses but very small
bulges that are more typical of Sc galaxies than of earlier type
spirals (example: NGC 1411,
Laurikainen et al. 2006);
(2) considerable
evidence that S0 galaxies have pseudobulges just as in many spirals
(Laurikainen et al. 2007).
While the bulges of the latter are likely
to be made of rearranged disk material in many cases
(section 9), those
in S0s are likely to be related to the evolution of bars. S0 bulges
tend to be nearly exponential (Sersic index n
2), are
supported against gravity by rotation rather than random motions, and
often include clear inner disks; (3) good correlations between bulge
effective radii, re, and disk radial scalelength,
hR, as well as
between the Ks-band absolute magnitudes of the bulge
and disk, suggest that S0 bulges are not formed from hierarchical mergers,
implying that S0s could be stripped spirals, although the lower bar fraction
in S0s suggest that this is in conjunction with evolution due to bars
and ovals; (4) 70% of S0-S0/a galaxies have ovals or lenses,
suggesting that bars have been weakened in such galaxies over time; and
(5) not only bulges, but also disks of S0s are similar to those in
S0/a-Scd spirals.
The Two-Micron All-Sky Survey (2MASS, Skrutskie et al. 2006) provided near-IR JHKs images of a much larger galaxy sample than either the OSUBSGS or NIRS0S, although these images lack the depth of the OSUBSGS and NIRS0S images in general. 2MASS provided considerable information on near-infrared galaxy morphology, which led to the extensive 2MASS Large Galaxy Atlas (Jarrett et al. 2003).
The best imaging of galaxies at mid-IR wavelengths has been obtained with the Spitzer Space Telescope using the Infrared Array Camera (IRAC, Fazio et al. 2004) and 3.6, 4.5, 5.8, and 8.0µm filters. The 3.6 and 4.5µm filters provide the most extinction-free views of the stellar mass distribution in galaxies, while the 5.8 and 8.0µm filters reveal the interstellar medium (ISM) (Pahre et al. 2004). The loss of coolant in 2008 prevented further observations with the 5.8 and 8.0µm filters, but the 3.6 and 4.5µm filters could still be used. This led to the Spitzer Survey of Stellar Structure in Galaxies (S4G, Sheth et al. 2010), a 3.6 and 4.5µm survey of 2,331 galaxies of all types closer than 40 Mpc. These wavelengths sample the Rayleigh-Jeans decline of the stellar spectral energy distribution of all stars hotter than 2000K. S4G images shown here are from Buta et al. (2010a) and are based on pre-survey archival images processed in the same manner as survey images. Spitzer observations have a very low background compared to groundbased near-IR observations, and thus IRAC images are the deepest galaxy images ever obtained in the IR.
Figure 41 compares images of M51 at four wavelengths: the GALEX 0.15µm band, the B-band (0.44µm), the near-infrared Ks band (2.2µm), and the IRAC 3.6µm band. Only the B and Ks-band images are from groundbased observations. The GALEX image reveals the extensive star formation in the spiral arms, and the complete absence of star formation in the companion NGC 5195 as well as in the complex tidal material north of the companion. The star formation in the arms is more subdued in the B-band, and almost completely subdued in the Ks-band. The arms are so smooth in the Ks band that the galaxy resembles an Sa or Sab system. (The B-band type is Sbc.) Surprisingly, this is not the case in the 3.6µm image whose considerably greater depth compared to the Ks-band image is evident. The spiral arms in the 3.6µm band are lined by numerous resolved objects, many of which are correlated with the star-forming regions seen in the B-band. This is dramatically seen also in the SB(s)cd galaxy NGC 1559 (Figure 42), where an IRAC 3.6µm image is compared with a B-band image. These show that resolved features in the deep 3.6µm image are well-correlated with B-band star-forming complexes. Thus, mid-IR 3.6µm images are not completely free of the effects of the extreme population I stellar component (see discussions in Block et al. 2009 and Buta et al. 2010a).
 |
Figure 41. Multi-wavelength images of M51. |
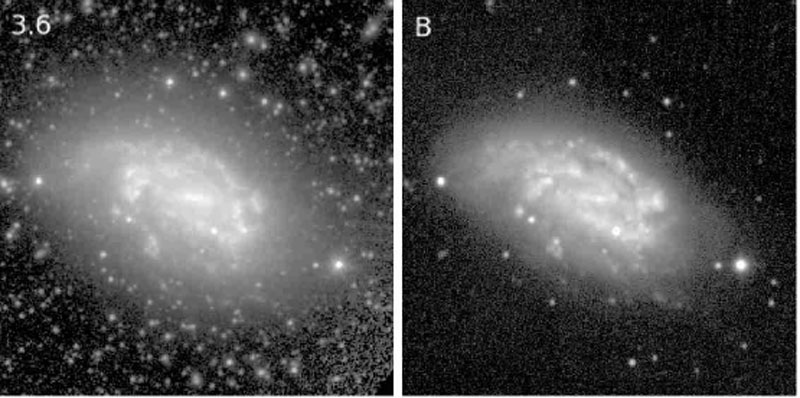 |
Figure 42. Comparison of IRAC 3.6µm image of NGC 1559 (left) with a ground-based B-band image of the same galaxy at right. Note the significant correspondence of features between the two very different wavelength domains in this case. |
A sampling of S4G images as compared to B-band images for the same galaxies from the dVA is shown in Figure 43. The four galaxies shown, NGC 584, 1097, 628, and 428, have dVA types of S0-, SBb, Sc, and Sm, respectively, thus covering almost the entire Hubble-de Vaucouleurs sequence. Although the very dusty interacting system NGC 1097 looks slightly "earlier" at 3.6µm, these images show again that on the whole the morphology in the two wavebands is very similar. The same is seen for other galaxies described by Buta et al. (2010a), who found that 3.6µm types, judged using the same precepts described in the dVA for blue light images, are well-correlated with blue-light types. On average mid-IR classifications for RC3 S0/a-Sc galaxies are about 1 stage interval earlier than B-band classifications, with little difference for types outside this range. The correlation is much better than what was expected from previous near-IR studies (Eskridge et al. 2002). 3.6µm galaxy morphology is sufficiently contaminated by recent star formation to allow the same criteria defined for blue light images to be used for galaxy classification, a surprising result.
 |
Figure 43. Comparison of IRAC 3.6µm images (left frames) with ground-based B-band images for (top to bottom): NGC 584, 1097, 628, and 428. |
Drastic differences between 3.6µm and B-band morphology are seen only for the most dusty galaxies. One example is NGC 5195, shown also in Figure 41. This galaxy, classified as Irr II in the Hubble Atlas and as I0 by de Vaucouleurs, appears as a regular early-type galaxy of type SAB(r)0/a (see also Block et al. 1994). Other galaxies that can look very different are flocculent spirals such as NGC 5055 (Figure 44). The flocculence largely disappears at 3.6µm, and a more global pattern is seen (see also Thornley 1996). The type of NGC 5055, Sbc, remains largely unchanged from B to 3.6 µm.
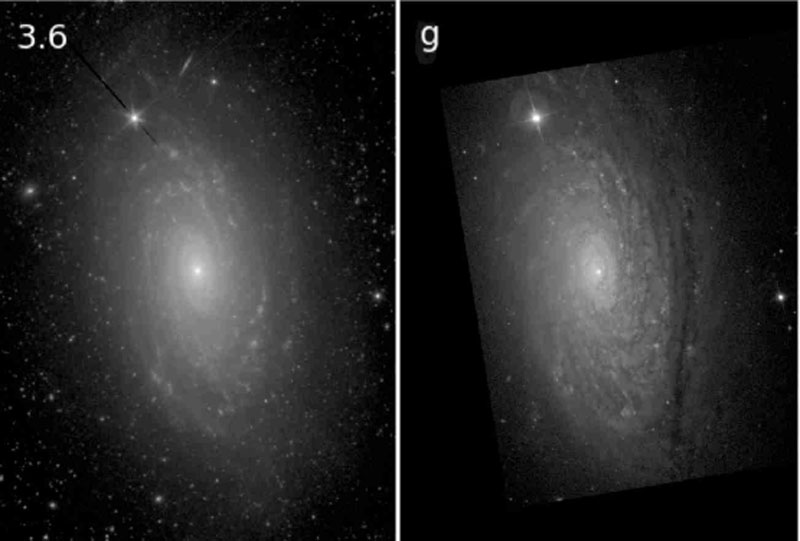 |
Figure 44. Comparison of IRAC 3.6µm and SDSS g-band images of the flocculent spiral galaxy NGC 5055. |
As noted by Helou et al. (2004), the mid-IR wavelength domain marks the transition from emission dominated by starlight to emission dominated by interstellar dust. While images at 3.6µm show the stellar bulge and disk almost completely free of dust extinction, an image at 8µm shows very little starlight but considerable emission from the ISM in the form of glowing dust.
Figure 45 shows an 8µm image of the nearby spiral galaxy M81 as compared to a B-I color index map coded such that blue star-forming features are dark while red dust lanes are light. The 8µm image of M81 shows that its ISM is closely associated with its spiral arms. Comparison with the B-I color index shows that both the star-forming arms as well as near-side dust lanes can be seen at 8µm. Even the far-side lanes in the bulge region are clear at 8µm, where no tilt asymmetry is manifested. Willner et al. (2004) argue that the dust emission from M81's ISM is likely dominated by polycyclic aromatic hydrocarbons (PAHs; Gillett et al. 1973) which have a prominent emission feature at 7.7µm. Willner et al. also showed good correspondence between the nonstellar dust emission in M81 and the distribution of near-ultraviolet (NUV) emission. Some regions with bright dust emission and little NUV emission were attributed to excessive UV extinction, while areas with bright NUV and little dust emission were attributed to the effects of supernovae.
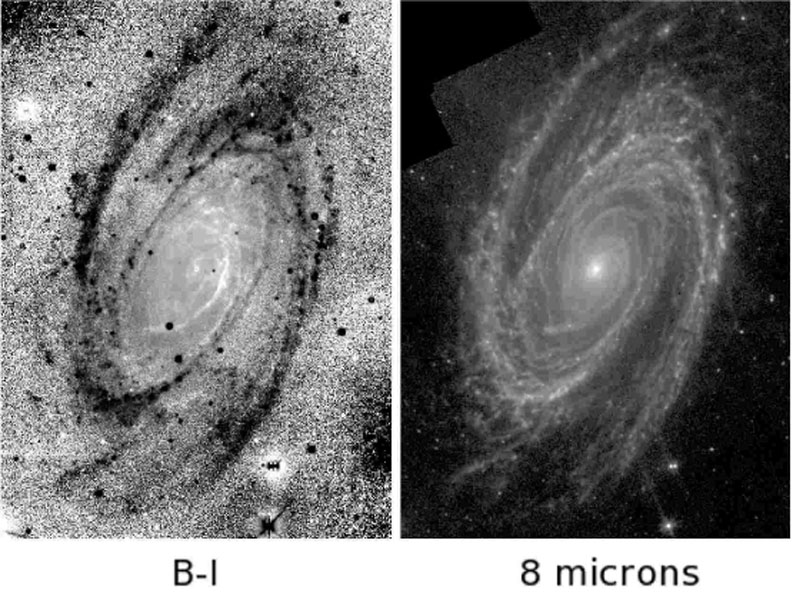 |
Figure 45. A comparison between a B-I color index map and an 8µm dust emission map of the nearby spiral galaxy M81. |
The B-I color index map of M81 shows an additional set of dust lanes that have no counterpart in the 8µm map. These lanes are oriented roughly perpendicularly to the major axis about halfway between the center and the northern arm. Sandage & Bedke (1994) interpret these as foreground dust associated with high galactic latitude nebulosities in the halo of our Galaxy.