


The Sloan Digital Sky Survey (York et al. 2000; Gunn et al. 1998) provides the largest body of information on the colors of galaxies. The multi-wavelength imaging in ugriz filters has allowed the production of high quality color images for thousands of galaxies. Although the Hubble-Sandage-de Vaucouleurs classification systems were based on blue light images alone, it is still possible to reliably classify galaxies with SDSS color images, which are based on combined gri images (Lupton et al. 2004). In such images one can directly see the stellar population differences that characterize different galaxy types.
Figure 48 shows the color Hubble sequence from
E to Sm. Once galaxy colors were systematically measured using
photoelectric photometry
(de Vaucouleurs, de
Vaucouleurs, & Corwin 1976),
it was
noted that integrated colors vary smoothly with advancing stage along
the Hubble sequence. The latest stages have corrected total color index
(B-V)T°
 0.3-0.4 while E and
S0 galaxies have (B-V)T°
0.9-1.0 (e.g.,
Buta et al. 1994).
The latter colors correspond to yellow-orange while the former are
bluish-white. The colors begin to change at S0/a and Sa and become
progressively bluer. Figure 48 shows the reason
for the change. Galaxies earlier
than Sa are dominated by old stars having the colors of K giants. As
stage advances from Sa to Sm, the spiral structure becomes
progressively more important compared to the bulge. Since the arms are
dominated by complexes of massive young stars, this makes the
integrated colors of the galaxies become progressively bluer until by
the end of the sequence, the bluer colors of these stars have overcome
the yellowish light of the background old disk stars.
Figure 48 also shows that the intermediate
colors of intermediate types such as Sb and Sc are due to the
yellowish-orange colors of bulges and bars as combined with the bluer
colors of spiral arms.
0.3-0.4 while E and
S0 galaxies have (B-V)T°
0.9-1.0 (e.g.,
Buta et al. 1994).
The latter colors correspond to yellow-orange while the former are
bluish-white. The colors begin to change at S0/a and Sa and become
progressively bluer. Figure 48 shows the reason
for the change. Galaxies earlier
than Sa are dominated by old stars having the colors of K giants. As
stage advances from Sa to Sm, the spiral structure becomes
progressively more important compared to the bulge. Since the arms are
dominated by complexes of massive young stars, this makes the
integrated colors of the galaxies become progressively bluer until by
the end of the sequence, the bluer colors of these stars have overcome
the yellowish light of the background old disk stars.
Figure 48 also shows that the intermediate
colors of intermediate types such as Sb and Sc are due to the
yellowish-orange colors of bulges and bars as combined with the bluer
colors of spiral arms.
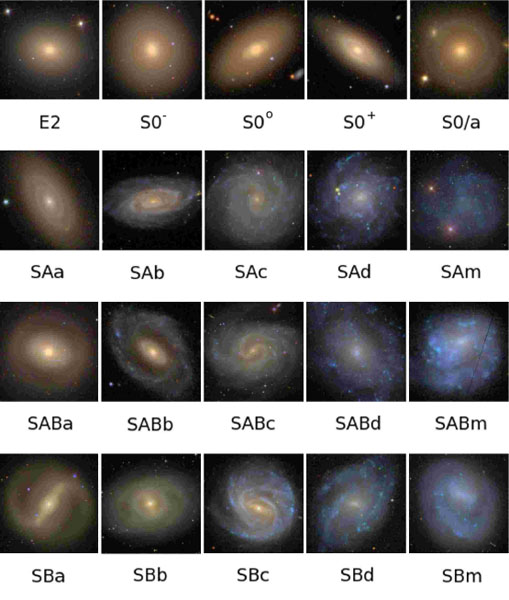 |
Figure 48. The Hubble tuning fork of ellipticals, S0s, and spirals of different bar classifications are shown here using SDSS color images. The galaxies are (left to right): Row 1 - NGC 3608, 4203, 6278, 4324, and 932. Row 2 - NGC 4305, 5351, 3184, 5668, and IC 4182. Row 3 - NGC 4457, 5409, 4535, 5585, and 3445. Row 4 - NGC 4314, 3351, 3367, 4519, and 4618. |
The analysis of integrated SDSS galaxy colors for more than 100,000
galaxies led to one of the most dramatic findings of the survey: a
clear bimodality in the distribution of color that correlates with
morphology: a red peak that includes mainly E, S0, and Sa galaxies, and
a blue peak that includes mainly Sb, Sc, and Irr galaxies
(Strateva et al. 2001).
Although the correlation of galaxy color with types had been
known for a long time from photoelectric measurements (e. g.,
de Vaucouleurs 1961;
Buta et al. 1994),
the large sample provided by SDSS
allowed the bimodality to be demonstrated to a high degree of
significance. In plots of u-r color index versus absolute
Mr
magnitude, the galactic equivalent of a stellar H-R diagram, nearby
early-type galaxies follow a narrow band called the red sequence, while
nearby later-type, mostly star-forming galaxies appear as a broad blue
sequence (also sometimes called the "blue cloud").
Baldry et al. (2004)
showed that the bimodality (in the form of a double Gaussian
number distribution over all types) is detectable from
Mr
-15.5 to Mr
-23, being
undetectable only for the most luminous galaxies.
Wyder et al. (2007)
showed that use of GALEX
near-ultraviolet magnitudes and optical r-band magnitudes provides
even greater discrimination between the Gaussian components.
Bell et al. (2004)
showed that the bimodality is detectable in faint galaxies
to z 1,
indicating that this characteristic of the galaxy
population extends to a lookback time of at least 9 Gyr. It is thought
that galaxies evolve from the blue sequence to the red sequence as
their star formation is quenched, perhaps through mergers, gas
depletion, or AGN feedback (e.g.,
Martin et al. 2007).
The possibility
of evolution has engendered great interest in the galaxies lying near
the minimum of the bimodal distribution (the so-called "green valley";
Thilker et al. 2010
and references therein).
Virtually all the galaxies shown in Figure 48 are of relatively high luminosity, with absolute blue magnitudes MB° averaging about -20. When physical parameters such as MB° are considered, it becomes clear that the peculiar shape of the de Vaucouleurs classification volume shown in Figure 3 only highlights the morphological diversity of families and varieties at each stage, but does not tell us about the physical parameter space at each stage, which expands considerably at each end of the volume (McGaugh, Schombert, and Bothun 1995). Most known dwarf galaxies are either early or late-type, but not intermediate.
15.2.1. dE, dS0, BCD, and cE Galaxies
The most extensive study of dwarf galaxy morphologies was made by Binggeli, Sandage, & Tammann (1985 = BST), who used deep photographs to probe the low luminosity population of the Virgo Cluster, using mostly morphology to deduce cluster membership. Examples of several categories of Virgo Cluster dwarf galaxies are shown in Figure 49 using SDSS color images and the classifications of BST. The most common type is the dwarf elliptical, or dE type, which accounts for 80% of the galaxies in the BST catalogue. dE galaxies range from MB = -18 to -8 (Ferguson & Binggeli 1994). Many dEs have an unresolved, star-like nucleus whose presence is indicated by an N attached to the type, as in dE0,N. The top right panels of Figure 49 show three fairly typical examples. Possibly related to these normal dE systems are the larger, lower surface brightness ellipticals ("large dE") shown in the two lower right frames of Figure 49.
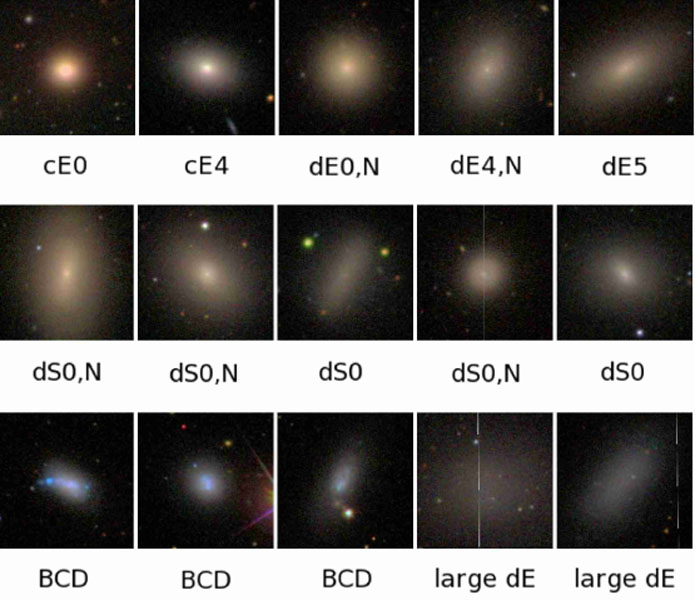 |
Figure 49. Examples of dwarf galaxies in the Virgo Cluster, drawn from the catalogue of Binggeli, Sandage, & Tammann (1985) and highlighted using SDSS color images. The classifications are from the BST catalogue and the galaxies are (left to right): Row 1 - NGC 4486B, IC 767, IC 3470, IC 3735, and UGC 7436. Row 2 - NGC 4431, IC 781, IC 3292, VCC 278, IC 3586. Row 3 - VCC 459, VCC 2033, VCC 841, IC 3475, and IC 3647. |
The second row of Figure 49 shows examples of the interesting class of dwarf S0 galaxies. All of the examples shown are distinct from dEs in showing a smooth structure but with additional features such as a lens or a weak bar. dS0 galaxies can also be nucleated and are called dS0,N. In addition to the low surface brightness dEs and dS0s, the Virgo Cluster includes two high surface brightness classes of dwarfs. The cE category refers to compact ellipticals that resemble M32.
The blue compact dwarf (BCD) galaxies are a special class of star-forming dwarf irregulars characterized by a few bright knots imbedded in a stellar background of low surface brightness (Sandage and Binggeli 1984). The most extreme cases are nearly stellar (Thuan & Martin 1981). The knots are often super star clusters associated with 30-Doradus-like HII regions, and the faint background can be very blue (Thuan et al. 1997). Spectroscopically, BCDs have narrow emission lines superposed on a blue continuum, and the lines indicate a low metallicity. Figure 49 shows three examples from the BST Virgo Cluster catalogue. Gil de Paz et al. (2003) present an atlas of more than 100 BCDs that highlight their structure.
As described in section 5.1, the dE galaxies shown in Figure 49 are not the low luminosity extension of more luminous ellipticals. These together with the dS0 class are labeled "spheroidal" galaxies by Kormendy et al. (2009; see Figure 6), who confirmed the finding by Kormendy (1985) that these galaxies are more related to evolved low luminosity spirals and irregulars than to genuine ellipticals. Based on correlations of well-defined photometric parameters (e.g., central surface brightness or velocity dispersion versus core radius or absolute magnitude), these authors link ellipticals like M32 to the actual low luminosity end of the E galaxy sequence (see also Wirth & Gallagher 1984). Thus, the cE galaxies shown in Figure 49 are in a sense truer "dwarf ellipticals" than the dE galaxies shown. This does not negate the value of the BST classifications, since these are purely morphological interpretations.
15.2.2. Local Group Dwarf Spheroidals and Irregulars
The lowest luminosity galaxies that we can study in detail are in the
Local Group. Fortunately, a few are in the area covered by the SDSS so
that they can be illustrated in color. These objects, all fainter than
MV = -12, are shown in
Figure 50. Leo I and Leo II are
usually called dwarf spheroidal, or dSph, galaxies (e.g.,
Ferguson & Binggeli
1994).
dSph galaxies tend to have to have absolute visual
magnitudes MV > -15 and a low degree of flattening;
they are believed to be the most abundant type of galaxy in the
Universe. Leo I (MV = -11.9) and Leo II
(MV = -9.6) look different in part
because of their different star formation histories. dSph and dwarf
irregular (dI) galaxies are now known to have complex and varied star
formation histories that may involve multiple episodes of star
formation and effects of interactions
(Mateo 1998
and references therein). The other two galaxies in
Figure 50, Leo A and
DDO 155, are dwarf irregulars having
MV
-11.5. A detailed HST
study of the stellar content of Leo A
(Cole et al. 2007)
showed that 90% of the star formation in the galaxy occurred less than 8
Gyr ago, with a peak at 1.5-3 Gyr ago. A useful summary of the properties of
dSph galaxies is provided by
van den Bergh (1998)
and, most recently, by
Tolstoy, Hill, & Tosi
(2009),
who also discuss the star formation histories of Local Group dI galaxies.
 |
Figure 50. Four Local Group dwarfs having MV > -12 (left to right): Leo I, Leo II, Leo A, and DDO 155 (all SDSS color images) |
The SDSS has facilitated the discovery of many new Local Group dwarf
galaxies
(Belokurov et al. 2007).
For example, the SDSS led to the
discovery of one of the faintest known dSph galaxies, a new dwarf in
Ursa Major (called the UMa dSph) having MV
-7
(Willman et al. 2005).
Most interesting is Leo T, which is an MV = -7.1
dSph galaxy with some recent star formation, providing one of the most
dramatic illustrations of the link between dSph and dI galaxies, and
the least luminous galaxy known to have recent star formation
(Irwin et al. 2007).
Sandage & Binggeli
(1984)
described the classification of dwarf galaxies based on the Virgo Cluster, and concluded that there are "no real
dwarf
spirals." This refers mainly to dwarf spirals that might be classified
as types Sa, Sb, or Sc, i.e., having both a bulge and a disk. Dwarf
late-type spirals are already built into de Vaucouleurs's modified
Hubble sequence as Sd-Sm types and connect directly to Magellanic
irregulars, as shown in Figure 1 of
Sandage & Binggeli
(1984).
Thus, any genuine examples of
dwarf Sa, Sb, or Sc spirals would be of great interest as they would
challenge the idea that for a galaxy to be able to make well-defined
spiral arms, it would have to be more massive than some lower limit
(estimated as 5 × 10⁹
M by
Sandage & Binggeli).
by
Sandage & Binggeli).
Four of the best cases of genuine dwarf spirals are illustrated
in Figure 51. The two rightmost frames
show IC 783
(BST type dS0,N) and IC 3328
(BST type dE1,N), both Virgo Cluster members having absolute
magnitudes MB°
-16 to -17, and found
to have subtle spiral structure by
Barazza, Binggeli, &
Jerjen (2002)
and
Jerjen, Kalnajs, &
Binggeli (2000),
respectively. The patterns are hard to see in the direct SDSS color images
shown in Figure 51, but
these authors use photometric models,
Fourier decomposition, and unsharp-masking to verify
the reality of the patterns. Barraza et al. conclude that many
of the bright early-type dwarfs in the Virgo Cluster have disks.
An example with a bar and spiral arms is NGC 4431 (shown as
dS0 in Figure 49).
 |
Figure 51. Four dwarf spiral galaxies (left to right): NGC 3928, D563-4, IC 783, and IC 3328 |
The leftmost panel of Figure 51 shows an HST wide V-band image (Carollo et al. 1997) of NGC 3928, an absolute magnitude MB° = -18 galaxy which on small-scale, overexposed images looks like an E0, but which harbors a miniature (2 kpc diameter), low-luminosity Sb spiral (van den Bergh 1980b). Based on spectroscopic analysis, Taniguchi & Watanabe (1987) have suggested that NGC 3928 is a spheroidal galaxy which experienced an accretion event that supplied the gas for star formation in the miniature disk.
Schombert et al. (1995)
brought attention to possible dwarf field spirals.
One of their examples, D563-4, is shown in the second frame from the
left in Figure 51. This galaxy has
MB°
-17. A few
other examples are given in the paper, and Schombert et al. find
that they are not in general grand design spirals, are physically
small, and have low HI masses. However,
van den Bergh (1998)
considers all of Schombert et al.'s examples as subgiant spirals rather
then true dwarf spirals. A possible true dwarf spiral given by
van den Bergh is DDO 122 (type S V).
15.3. Galaxy Zoo Project/a>
The Galaxy Zoo project
(Lintott et al. 2008)
has made extensive use of
SDSS color images. The project uses a website to enlist the help of
citizen scientists worldwide to classify a million galaxies as well as
note interesting and unusual cases in various forum threads. With such
a large database to work from, and the potential for discovery being
real, the project has attracted many competent amateur galaxy
morphologists. One such discovery was a new class of galaxies called
"green peas," which are star-like objects that appear green in the
SDSS composite color images (Figure 52,
left).
Cardemone et al. (2009)
used auxiliary SDSS data to show that peas are galaxies that
are green because of a high equivalent width of [OIII] 5007 emission.
They are sufficiently distinct from normal galaxies and quasars in a
two-color g-r vs. r-i plot that such a plot
can be used to identify
more examples. Other characteristics noted are that peas are rare, no
bigger than 5 kpc in radius, lie in lower density environments than
normal galaxies, but may still have morphological characteristics
driven by mergers, are relatively low in mass and metallicity, and have
a high star formation rate. Cardemone et al. conclude that peas are a
distinct class of galaxies that share some properties with luminous
blue compact galaxies and UV-luminous high redshift galaxies.
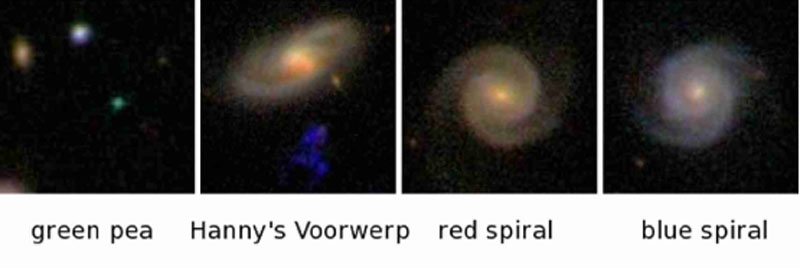
Figure 52. Interesting morphologies and
color characteristics found
by the Galaxy Zoo project team participants. A "green pea" is a
star-like galaxy with a high flux in [OIII] 5007.
"Hanny's Voorwerp" is a cloud of ionized gas
that may be the light echo of a quasar outburst in the nucleus
of nearby IC 2497. Red spirals are morphologically similar to
blue spirals, but have a lower star formation rate. (All SDSS color
images)
Another prominent colorful galactic-sized object identified by Galaxy
Zoo is "Hanny's Voorwerp"
(Figure 52), a
peculiar collection of blue clumps just south of IC 2497.
Lintott et al. (2009)
found that
the Voorwerp is mostly ionized gas, and after ruling out
some possible
sources of ionizing radiation, concluded that the object could be the
first identified case of a quasar light echo. The implication is that
the companion galaxy underwent a temporary quasar phase.
Masters et al. (2010)
examine the properties of face-on late-type
spiral galaxies whose colors are much redder than is typical
(Figure 52, right panels), suggesting that they
are passive
objects where star formation has largely ceased or is lower than
normal. These authors showed that red spirals are not excessively
dusty and tend to be near the high end of the mass spectrum. A range of
environmental densities was found, implying that environment alone is
not sufficient to make a spiral red. A significantly higher bar
fraction was found for red spirals as compared to blue spirals, which
Masters et al. suggest could mean the bars themselves may have acted to
shut down the star formation in these galaxies.
A major philosophical aspect of Galaxy Zoo is the value of human visual
interpretation of galaxy morphology. That is, the human eye can
integrate the detail in an image more reliably than a computer program
can, in spite of the latter's ability to classify numbers of galaxies
well beyond the capability of a single individual. This philosophy was
used to compile a major catalogue of galaxy merger pairs described by
Darg et al. (2010).
In the initial set-up of Galaxy Zoo, a single
button allowed a classifier to select whether an object was a "merger"
based simply on the appearance of peculiarities. For each galaxy, a
weighted average number, fm, was derived that
characterized the
fraction of classifiers who interpreted a pair of galaxies as a merger,
essentially "morphology by vote" and in a way reminiscent of RC3 where
morphological types were in many cases based on a weighted average from
a small number of classifiers
(Buta et al. 1994).
Taking fm > 0.4,
Darg et al. (2010)
identified 3003 pairs and groups of merging
galaxies, and also showed that the spiral to elliptical galaxy ratio in
merger pairs is a factor of two higher than for the global galaxy
population, suggesting that mergers involving spirals are detectable
for a longer period than those that do not involve spirals.
A similar philosophy to Galaxy Zoo was used by
Buta (1995)
to compile the Catalogue of Southern Ringed Galaxies, and also by
Schawinski et al. (2007),
who visually classified 48,023 SDSS galaxies to identify a
significant-sized sample of early-type galaxies for a study of the
connection between nuclear activity and star formation. In the latter
study, visual interpretation was argued to be needed to avoid bias
against star-forming early-type galaxies which would be excluded
from color-selected samples. A major result of this study was the
identification of a time sequence whereby an early-type galaxy has
its star formation suppressed by nuclear activity, a manifestation
of AGN feedback.
If interactions and mergers can have profound effects on
galaxy morphology, then the morphology of isolated galaxies
clearly is of great interest. Such galaxies allow us to see how
internal evolution alone affects morphology, i. e., what pure
"nature" morphologies look like.
Karachentseva (1973)
compiled
a large catalogue (the Catalogue of Isolated Galaxies, or
CIG) of 1050 isolated galaxies that has proven very useful
for examining this issue. A galaxy of diameter D is sugggested
to be isolated if it has no comparable-sized companions of diameter
d between D/4 and 4D within a distance of 20d.
Verdes-Montenegro et
al. (2005)
show that this means that an isolated galaxy 25 kpc in diameter,
in the presence of a typical field galaxy velocity of 150 km s-1,
has not been visited by a comparable mass companion during the
past 3 Gyr. These authors discuss the limitations of the CIG (e. g.,
the isolation criteria do not always work),
but in general it is the best source of isolated galaxies available.
Sulentic et al. (2006)
examined all 1050 CIG galaxies on Palomar II
sky suvey charts in order to refine the sample and found that isolated
galaxies cover all Hubble
types. Of these, 14% were found to be E/S0 types, while 63% were
Sb-Sc types, with the spiral population more luminous than the E/S0
population. Over the type range Sa-Sd, the proportion
rises to 82%. Thus, an isolated galaxy sample is very spiral-rich.
Nevertheless, the presence of
early-type galaxies in the sample implies that these are not likely
to be "nurture" formed, as such galaxies might be in denser environments.
The refinement of the CIG sample forms the basis of the Analysis of the
Interstellar Medium of Isolated Galaxies (AMIGA) project
(Verdes-Montenegro et
al. 2005).
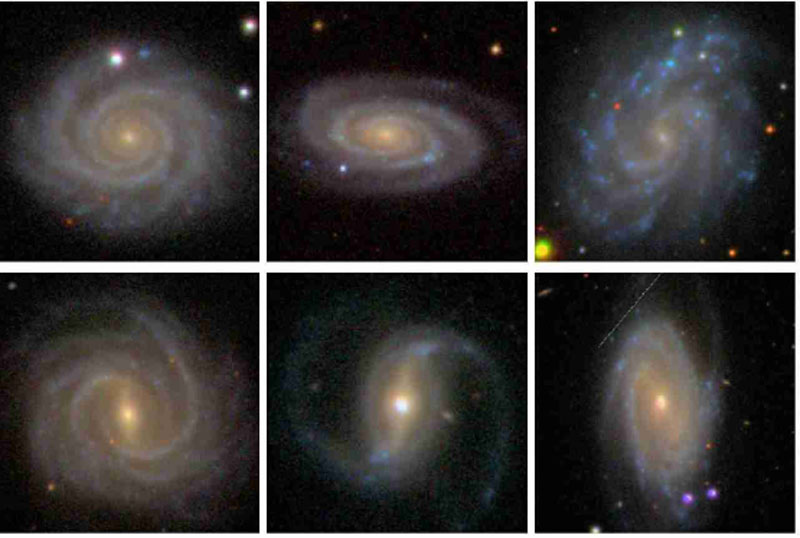
Figure 53 shows six examples of isolated Sb-Sc
galaxies from the AMIGA sample, based on SDSS color images. All of these
look relatively normal, but it is interesting how nonbarred galaxies like
NGC 2649 and 5622 (upper left frames in
Figure 53) show
such conspicuous global spirals, which argues that the spirals in these
galaxies have not been excited by an interaction.
Figure 53. SDSS color images of six
isolated Sb-Sc galaxies, both barred and nonbarred, from the
AMIGA sample, a refined version of the Catalogue of Isolated Galaxies
(Karachentseva 1973).
The galaxies are (left to right): Row 1: NGC 2649,
5622, and 5584; Row 2: NGC 4662, 4719, and 2712.
Durbala et al. (2008)
analyzed the photometric properties of 100 isolated Sb-Sc AMIGA galaxies,
and found that a majority have pseudobulges rather than classical bulges.
In comparing the properties of isolated galaxies with a sample of Sb-Sc
galaxies selected without an isolation criterion, Durbala et al. found
that isolated spirals have longer bars and, using CAS parameters,
also less asymmetry, central concentration, and clumpiness,
Durbala et al. (2009)
analyzed the Fourier properties of the same set of
100 isolated spirals, and estimated bar lengths and strengths. Earlier
types in the sample were found to have longer and higher contrast bars
than later types. Spiral arm multiplicities were investigated also,
and it was shown that cases having an inner m = 2 pattern and an
outer m = 3 pattern occurred in 28% of the sample.
Elmegreen, Elmegreen, &
Montenegro (1992)
argued that in such morphologies, the m = 3
pattern is driven internally by the m = 2 pattern, and that
three-armed patterns measure the time elapsed since an interaction.
15.5. Deep Field Color Imaging
Particularly interesting in the domain of color galaxy morphology are
the various deep field surveys that have been at the heart of high
redshift studies. The most recent is the HST Wide Field Camera 3 Early
Release Science (ERS) data
(Windhorst et al. 2010),
which provides very deep panchromatic
images based on 10 filters ranging from 0.2µm to
2µm in wavlength. Figure 54
shows three subsections of the main ERS field, which coincides with the
GOODS south field
(Giavalisco et al. 2004).
The galaxies seen range in redshift
from z = 0.08 to at least z = 3.
Windhorst et al. (2010)
argue that images like the ERS field are deep enough to allow probing of
galaxy evolution in the crucial redshift range z
Figure 54. Three subsections from the
WFC3-ERS survey of the GOODS-south field
(Windhorst et al. 2010).
The colors are based on images obtained
with 10 filters ranging from 0.2 µm to 2 µm.
1-3 where the
galaxies assembled into their massive shapes. By z
1, the Hubble
sequence was largely in place.
Figure 54 shows a variety of interesting nearby as
well as high z morphologies, including some of those illustrated
in Figure 46.
Images like the ERS field allow us to connect the local and distant
galaxy populations in unprecedented detail.
