


In this section, I will briefly discuss the effect of dust attenuation on both the stellar continuum and the ionised gas line emission. Because of the complexity of the topic, this section will be incomplete, and the interested reader is referred to the included list of references, and to the review of Calzetti (2001).
I make here the explicit distinction between `attenuation' (minted for such use by Gerhardt Meurer, to my best recollection) and `extinction'.
Extinction refers to the combined absorption and scattering (out of the line of sight) of light by dust. The light is provided by a background point source (star, quasar), and the dust is entirely foreground to the source. Because the source is a background point, the distribution of the foreground dust is irrelevant to the total extinction value (left panel of Fig. 1.3).
 |
Figure 1.3. The left (a) and right (b) panels are cartoon representations of: a) a point source (star) behind a screen of dust; and b) an extended distribution of stars mixed with clumps of dust. The left panel shows the typical configuration that enables measures of extinction curves: a single illuminating source located in the background of the dust. The dust extinguishes the light via direct absorption and via scattering out of the line of sight. The right panel is more representative of the situation encountered whenever a complex distribution of stars and dust is present, as found in external galaxies and large regions. In this case, different stars may encounter different numbers of dust clouds (differences in optical depth), and some stars can be entirely embedded in dust (internal extinction) or be completely foreground to the dust distribution. Scattering of the light by dust both into and out of the line of sight is present. Because of the more complex geometrical relation between dust and the illuminating sources, the net effect of dust on the stellar population's SED is termed attenuation. |
Attenuation refers to the net effect of dust in a complex geometrical distribution, where the light sources are distributed within the dust at a range of depths, including in front of and behind it, and the dust itself can be clumpy, smooth, or anything in between. Because both the light sources and the dust have extended distributions, their relative location has a major impact on the net absorbed and scattered light, the latter now including scattering into, as well as out of, the line of sight (right panel of Fig. 1.3). Dust scattering into the line of sight has the effect of producing a greyer overall attenuation than if only scattering out of the line of sight were present, and the emerging SED will be bluer. This is the typical situation encountered when studying galaxies or extended regions within galaxies.
The radiative transfer of light through dust is described by an integro-differential equation. At UV/optical/near-IR wavelengths, the radiative transfer equation is:
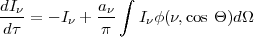 |
(1.13) |
where I is
the light intensity,
is
the light intensity,
 is the optical depth
through the
dust, a is
the dust albedo (i.e., the ratio of the
scattering coefficient to the sum of the scattering and absorption
coefficients),
is the optical depth
through the
dust, a is
the dust albedo (i.e., the ratio of the
scattering coefficient to the sum of the scattering and absorption
coefficients),
 (,
cos
(,
cos  ) is the
scattering phase function, and
is the angle
between the scattered photon and the line of sight. Expressions for both
a and
(,
cos ) are given in
Draine (2003b).
In the equation above, we have neglected the source function, i.e., the
dust emission, which usually has small values for wavelengths shorter
than a few µm. The first term to the right-hand side of the
equation describes the decrease in intensity of the original beam due to
passage inside the dust, and the second term is the light added to the
beam by scattering into the line of sight.
) is the
scattering phase function, and
is the angle
between the scattered photon and the line of sight. Expressions for both
a and
(,
cos ) are given in
Draine (2003b).
In the equation above, we have neglected the source function, i.e., the
dust emission, which usually has small values for wavelengths shorter
than a few µm. The first term to the right-hand side of the
equation describes the decrease in intensity of the original beam due to
passage inside the dust, and the second term is the light added to the
beam by scattering into the line of sight.
General solutions to the problem of how to remove the effects of dust from extended systems are not available. One of the first papers to address this issue specifically for galaxies is due to Witt et al. (1992). Since then, many codes have been made available to the community to treat the radiative transfer of the light produced by a stellar population through dust, with the goal of simulating realistic SEDs of galaxies. As many such codes exist, it is impossible to do justice to them all, and I shall avoid injustice by citing none.
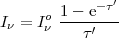
For the simple case in which there is a single point-like light source behind a screen of dust, Equation 1.13 reduces to
 |
(1.14) |
with the well-known solution for the extinction of a stellar spectrum by foreground dust
 |
(1.15) |
where
Io
is the incident light and
 |
(1.16) |
is the optical depth, which is related to the extinction curve
 (
( )
through the colour excess E(B - V). The colour
excess is a measure of the thickness of the dust layer, while the
extinction curve provides a measure of
the overall cross-section of dust to light as a function of wavelength.
Observational measures of extinction curves have been obtained only for the
Milky Way, the Magellanic Clouds, and M 31
(Cardelli et al.
1989;
Bianchi et al.
1996;
Fitzpatrick 1999;
Gordon et al.
2003,
2009),
because these are the only galaxies for which individual stars can be
isolated and the extinction properties of the dust in front of them
determined. For more distant systems, `extinction' measures are more
properly `attenuation' measures.
)
through the colour excess E(B - V). The colour
excess is a measure of the thickness of the dust layer, while the
extinction curve provides a measure of
the overall cross-section of dust to light as a function of wavelength.
Observational measures of extinction curves have been obtained only for the
Milky Way, the Magellanic Clouds, and M 31
(Cardelli et al.
1989;
Bianchi et al.
1996;
Fitzpatrick 1999;
Gordon et al.
2003,
2009),
because these are the only galaxies for which individual stars can be
isolated and the extinction properties of the dust in front of them
determined. For more distant systems, `extinction' measures are more
properly `attenuation' measures.
A few other `almost' exact solutions are available for Equation 1.13, and all of them require replacing the integral on the right-hand side of the equation with some mean or central value, so the equation changes to a pure differential one. Mathis (1972) and Natta & Panagia (1984) provide an expression for the case of internal extinction, which geometrically corresponds to a homogeneous mixture of stars and dust:
 |
(1.17) |
where ' is an effective
optical depth that needs to include the mean
effects of scattering into the line of sight
(Mathis 1983).
The two cases of foreground dust (screen; Equation 1.15) and internal dust (homogeneous mixture; Equation 1.17) are shown in Fig. 1.4. This cartoon representation uses the same input stellar SED and dust characteristics, including the dust thickness, as described by the colour excess E(B - V) = 0.5, and the dust extinction curve, which I take to be the standard Milky Way curve with RV = AV / E(B - V) = 3.1 (e.g., Fitzpatrick 1999). Despite all similarities, the different geometrical relation between stars and dust produces dramatic differences in the output SED, as shown by the two plots to the right hand side of Fig. 1.4. In general, a foreground screen produces the largest reddening and dimming of all possible dust geometrical configurations. This is a possible choice if the goal is to maximise the impact of dust on a stellar (or other source) SED.
 |
Figure 1.4. The top and bottom panels show cartoon representations of the same extended distribution of stars and dust, but with a different geometrical relation between each other. In the top panel the dust and stars are homogeneously mixed, while in the bottom panel the dust is completely foreground to the stars. The characteristics of the stars are the same in the two panels. I have assumed that in both cases the dust obeys the Milky Way extinction curve (which has a prominent absorption feature at 2175 Å) with a thickness of E(B - V) = 0.5. The panels to the right show the input stellar SED, which is the same for the two cases (blue; top spectrum), and the output SED (red; bottom spectrum). All other characteristics being equal, the different geometric relation between dust and stars has considerable impact on the emerging spectrum (`Output'). |
A homogeneous mixture of dust and stars, conversely, produces an almost grey attenuation, with the output SED remaining basically blue even at UV wavelengths. Adding dust to this configuration does not change the shape of the SED in any major way, but mostly dims it. Thus, at UV/optical wavelengths, the SED of a mixed dust/star system will appear very similar to the SED of a dimmer, almost dust-free system. Only a FIR measurement will be able to discriminate among the two systems.
The degeneracy described above is just one of the many degeneracies that are possible when limited information is available on a galaxy SED. A notorious one is the age/dust degeneracy, for which a young, dusty stellar population can have a UV/optical/near-IR SED not dissimilar from that of an old, dust-free population. Breaking of degeneracies usually requires collecting as much information as possible about a system, including, but not limited to, emission line luminosities, the magnitude of the 0.4 µm break (Dn(4000), e.g., Kauffmann et al. 2003), and the IR dust luminosity.
A concrete example of how to constrain the dust distribution in a
complex system involves the use of hydrogen recombination lines. The
intrinsic line-intensity ratio between these lines is set by quantum
mechanics, with relatively small variations as a function of electron
temperature and density if the lines are at the wavelength of
Br or bluer. Measurements of at least three emission lines, widely spaced
in wavelength, probe different dust optical depths, which, when
combined, provide strong constrains on the dust geometry, at least up to
the longest wavelength probed (e.g.,
Calzetti 2001).
As an example, the three recombination lines
H
or bluer. Measurements of at least three emission lines, widely spaced
in wavelength, probe different dust optical depths, which, when
combined, provide strong constrains on the dust geometry, at least up to
the longest wavelength probed (e.g.,
Calzetti 2001).
As an example, the three recombination lines
H at 0.4861
µm,
P at 1.282
µm, and
Br probe
a factor of ten total difference in optical
depth between the bluest and the reddest line, with a factor of four
between H
and P. A
common approach when only two lines are available, which most typically are
H and
H
at 0.4861
µm,
P at 1.282
µm, and
Br probe
a factor of ten total difference in optical
depth between the bluest and the reddest line, with a factor of four
between H
and P. A
common approach when only two lines are available, which most typically are
H and
H , is to adopt a foreground
dust screen, and derive a colour excess by taking the ratio of the
observed lines to that of the intrinsic line luminosity as:
, is to adopt a foreground
dust screen, and derive a colour excess by taking the ratio of the
observed lines to that of the intrinsic line luminosity as:
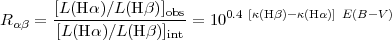 |
(1.18) |
where (H) and
(H)
are the values of the
extinction curve evaluated at the wavelength of
H and
H
((H) -
(H)
= 1.163 for the Milky Way extinction curve). Although this approach is
rather simplistic, it appears to work reasonably well for local
star-forming galaxies, which tend to have modest attenuation values,
AV ~ 1 mag,
(Kennicutt 1983;
Kennicutt et al. 2009),
and for `UV-bright starbursts' (see definition below;
Calzetti et al. 1996;
Calzetti 2001).
1.4.2. Application to galaxies
Despite galaxies being difficult to treat in a general fashion, a class of
low-redshift galaxies show relatively regular behaviour in their SEDs for
increasing dust content. I term these galaxies `UV-bright starbursts',
where we
use `UV-bright' to discriminate them from LIRGs and ULIRGs: the latter are
characterised by a centrally concentrated region of star formation
occupyingthe inner few hundred parsecs, with 90% or more of
their energy output emerging in the IR. We use the term `starbursts' to
discriminate them from `normal star-forming' galaxies, these being
characterised by widespread star formation across the disk with a
relatively low SFR surface density, i.e., such that SFR/area < 0.3-1
M yr-1 kpc-2.
UV-bright starbursts in the local Universe are galaxies in which the central
(inner
yr-1 kpc-2.
UV-bright starbursts in the local Universe are galaxies in which the central
(inner  1-2 kpc)
starburst dominates the light output at most
wavelengths, but which are still sufficiently transparent that a significant
fraction of their energy emerges in the UV.
1-2 kpc)
starburst dominates the light output at most
wavelengths, but which are still sufficiently transparent that a significant
fraction of their energy emerges in the UV.
The UV spectral slope,
, measured
in the range ~ 0.13-0.26 µm,
of local UV-bright starbursts is correlated with the colour excess
E(B - V), in the sense that higher values of the
colour excess produce redder UV SEDs for these galaxies
(Calzetti et al.
1994).
The UV spectral slope of these
galaxies is also correlated with the infrared excess, measured by the
ratio L(TIR) / L(UV)
(Meurer et al.
1999);
this correlation was termed the
IRX-
relation by the original authors, where IRX stands for
`infrared excess'. In recent years, with the wealth of UV imaging data
on local galaxies produced by GALEX, it has become customary to
replace the UV spectral slope
with the
UV colour FUV-NUV, but the
sense of the correlations has remained unchanged. The interpretation of
both correlations is straightforward: larger amounts of dust, as traced
by the colour excess E(B - V), produce both larger
reddening, traced by
, and
larger total attenuations, traced by L(TIR) / L(UV), in
the starbursts' SEDs. The power of such simple correlations, especially
the IRX-
one, can be immediately appreciated: at high redshift, rest-frame UV
spectral slopes are more immediately measurable than total attenuations,
since they only require the acquisition of an (observer-frame)
optical/near-IR spectrum or colour. The
IRX-
correlation is, indeed, obeyed by high-redshift starburst galaxies as well
(Reddy et al.
2010,
2012).
Two other important characteristics of the dust attenuation trends in local UV-bright starbursts are: (1) the absence of the 0.2175 µm `bump' (a common feature in the Milky Way extinction curve), which may be an effect of destruction of the carriers; and (2) the fact that the ionised gas emission suffers about twice the attenuation of the stellar continuum (Calzetti et al. 1994). This second characteristic appears to be present also in starburst galaxies at high redshift (e.g., Wuyts et al. 2011).
In terms of dust attenuation, local UV-bright starbursts behave as if the dust were located in a clumpy shell surrounding the starburst region (Calzetti et al. 1994; Gordon et al. 1997; Calzetti 2001). With this simple geometry, dust can be treated as a foreground screen, and the attenuation described as (Calzetti et al. 2000):
 |
(1.19) |
where e() is an effective
attenuation curve to be applied to the observed stellar continuum SED
fobs()
of a starburst galaxy to recover the intrinsic SED
fint(),
and with expression:
 |
(1.20) |
and E(B - V)star is the stellar continuum colour excess, which is smaller than that of the ionised gas, as follows:
 |
(1.21) |
E(B - V)gas is the same as the E(B - V) in Equation 1.18.
In the same spirit, the
IRX-
relation has been given as
(Meurer et al.
1999;
Calzetti 2001):
 |
(1.22) |
where L(UV) is centred around 0.15-0.16 µm, and
o
is the
intrinsic (unattenuated) UV slope of the galaxies, with typical values
o
~ -2.2 to -2.3, for constant star formation. An
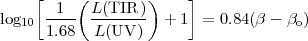
example of Equation 1.22 is given in Fig. 1.5,
together with the data originally used to derive it.
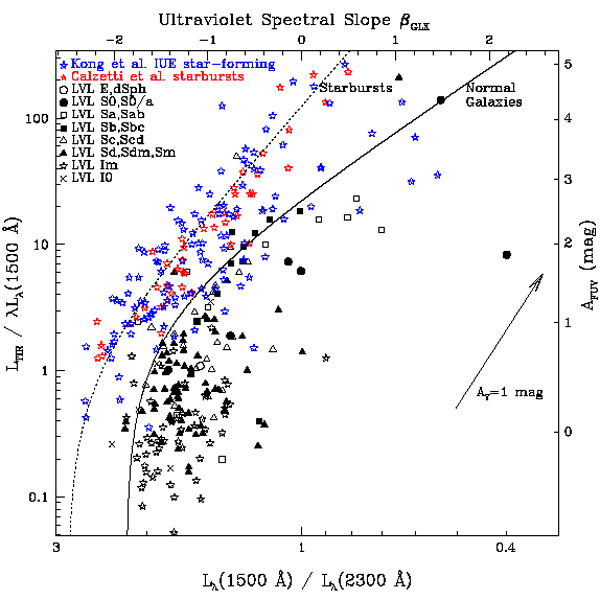 |
Figure 1.5. The
IRX- |
Deviations from the simple foreground geometry that can be used for
UV-bright starbursts were noted as soon as additional classes of
galaxies started to be investigated for systematic trends with dust
attenuation. Local LIRGS and ULIRGs, for instance, mostly fall above the
locus defined by Equation 1.22 in the IRX versus
plot (e.g.,
Goldader et al.
2002):
typically these galaxies have large IR excesses for their UV slopes. The
same trend is observed in high-redshift ULIRGs
(Reddy et al.
2010).
Geometries that can account for this behaviour include shells of
scattering dust and clumps
(Calzetti 2001),
which can be realised if the dust is located in close proximity to the
heating sources, as would be the case in the high-density central
regions of the IR-luminous galaxies.
Normal star-forming galaxies, as defined above, also deviate from the locus defined by Equation 1.22, as do star-forming regions within these galaxies. They generally tend to be located below the starburst curve, i.e., to have low IR excesses for their UV colours, and to have a large spread, about a factor 5-10 larger than the UV-bright starbursts (Fig. 1.5). This trend has been reported by a large number of authors who have analysed samples of local galaxies and regions within galaxies (Buat et al. 2002, 2005; Gordon et al. 2004; Kong et al. 2004; Calzetti et al. 2005; Seibert et al. 2005; Boissier et al. 2007; Dale et al. 2009; Boquien et al. 2009, 2012). Similar deviations have been reported also for some high-redshift galaxies (Reddy et al. 2012). The interpretation for both the shift towards lower IR excesses and the larger spread than starbursts varies from author to author, and includes: (1) a range of ages in the dominant UV populations; (2) scatter and variations in the dust geometry and composition; or (3) a combination of both. Perhaps, the third interpretation may ultimately be the correct one. Unlike starbursts, in which a more or less causally connected region dominates the energy output, normal star-forming galaxies are a collection of unconnected star-forming regions, each with its own dust geometry and mean age, amid an evolving, but not necessarily UV-faint, diffuse stellar population (Calzetti 2001). In such systems, the UV colour, which has the smallest leverage by covering the shortest wavelength range, will be very sensitive to influences from stellar populations and dust geometry variations (e.g., Kong et al. 2004; Calzetti et al. 2005; Boquien et al. 2009; Hao et al. 2011). Whether one or the other factor predominates, and under which conditions, is still subject of investigation, and it would be premature to provide here a definite answer.