


Within spiral galaxies, one may ask if the mass of the central black hole scales better with the bulge mass (or bulge-to-disk ratio), or perhaps some other property such as the pitch angle of the spiral arms (e.g. Seigar et al. 2008; Treuthardt et al. 2012; Berrier et al. 2013). If truly bulgeless galaxies do have active galactic nuclei (AGN), then the Mbh - Mbulge mass relation defined by big bulges can not apply for obvious reasons. The existence of spiral patterns in pure disk galaxies (e.g. Valencia-Enriquez & Puerari 2013) at least offers hope for an Mbh-(pitch angle) relation in disks with AGN but no bulge. However the possibly transient nature of spiral arms raises the question as to the time scale on which spiral arms may evolve (Minchev et al. 2012; Martinez-Garcia 2013; Shields 2013), and does this evolution trace the growth of the black holes (and bulges)? It may be of value to explore if the amplitude/contrast of the spiral arms (Grosbøl 2013) is important for the above mentioned Mbh-(pitch angle) relation given the existence of a) dwarf galaxies with very faint spiral arms (e.g. Jerjen et al. 2000; Graham et al. 2003), and b) the anemic spirals in the classification scheme of van den Bergh (1976).
In Fig. 6a, the bulges of barred galaxies appear to house black holes which are, on average, a factor of two less massive than those in non-barred galaxies of the same velocity dispersion (Graham 2008a, b, Hu 2008; Graham et al. 2011). However, as was initially speculated, this result is instead due to the bar's dynamics having elevated the velocity dispersion (Hartmann et al. 2013, see also Brown et al. 2013). That is, the barred galaxies are offset in velocity dispersion rather than black hole mass.
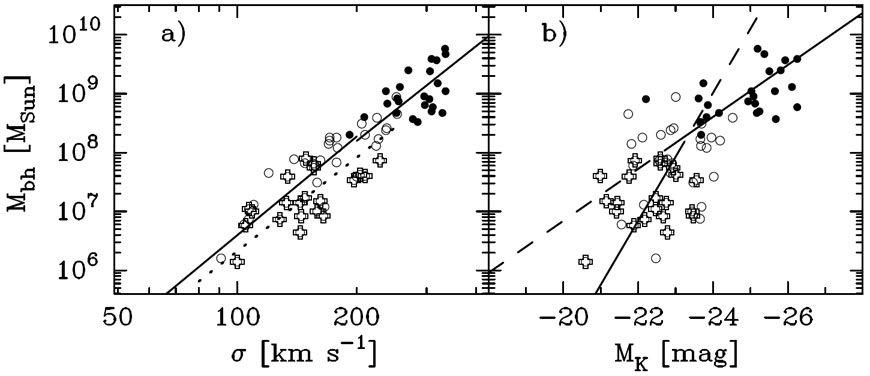 |
Figure 6. Black hole mass versus a) velocity dispersion and b) K-band bulge magnitude. Galaxies with depleted cores are shown by the filled circles. Galaxies without depleted cores are shown by the open symbols. Barred galaxies are shown by the crosses. Separate linear regressions have been applied to all three types in panel a), while the latter two types have been grouped together in panel b) due to the level of scatter in the current data (see Graham & Scott 2013 for more details). |
It is not yet established if barred galaxies follow a different distribution
in the Mbh - Lbulge diagram
(Fig. 6b).
One important, recent realisation is that because bulges of (barred
and non-barred) disk galaxies follow the Mbh ∝
5 scaling
relation (Fig. 6a),
and the luminosity L ∝
2 for
bulges with absolute B-band magnitudes fainter than MB
= -20.5 ± 1 mag (e.g.
Davies et al. 1983;
Matkovic & Guzmán
2005;
Kourkchi et al. 2012),
it requires that
Mbh ∝ L2.5 (or
Mbh ∝ Mbulge,dyn2,
if Mdyn / L ∝ L1/4)
1.
That is, there should not be a linear Mbh -
Mbulge relation for these galaxies, but rather a
near-quadratic relation, and this is what is observed in
Fig.6b
(Graham 2012;
Graham & Scott 2013;
Scott et al. 2013).
1 Note:
Cappellari et al. (2006)
report Mdyn / L ∝
L1/3, and the Mdyn -
relation from
Cappellari et al. (2013,
their figure 1) appears to show a bend at roughly 1011
M
 , in
the middle of the distribution where log[Mdyn /
L] = 0.75.
Back.
, in
the middle of the distribution where log[Mdyn /
L] = 0.75.
Back.