


10.1. The SFR main sequence and starburst galaxies
Alongside with the two modes of gas accretion, two main modes of star formation are known to control the growth of galaxies: a relatively steady rate in disk galaxies, although intermittent in dwarfs, which defines the main star formation rate-stellar mass sequence, and a starburst mode in outliers of such a sequence, fig. 28. Such starburst galaxies, which are generally interpreted as driven by mergers, are relatively rare at z ~ 2 and have considerably higher SFRs. In the aim of establishing the relative importance of these two modes, reference [132] analyzed several sample of galaxies. They conclude that merger-driven starbursts play a minor role for the formation of stars in galaxies, whereas they may represent a critical phase towards the quenching of star formation and morphological transformation in galaxies.
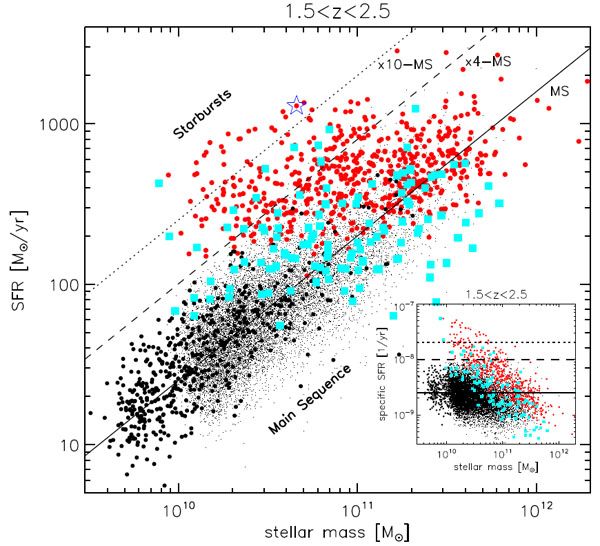 |
Figure 28. Star formation rate vs stellar mass relation at 1.5 < z < 2.5, for different samples of galaxies (various symbols). The solid black line indicates the Main Sequence of star forming galaxies, and a population of starbursts is evident in the top left panel. In the inset, the same relation is shown but as a function of specific SFR. Figure from [132]. |
Morphologies confirm this picture for luminous star-forming galaxies,
both locally and at z ~ 1
[133].
Most galaxies with IR luminosities above 3 × 10¹¹
L are
found to show merger-induced morphological disturbances and the fraction
of such deviations from normality increases systematically with distance
above the galaxy main sequence.
are
found to show merger-induced morphological disturbances and the fraction
of such deviations from normality increases systematically with distance
above the galaxy main sequence.
Star-forming galaxies at z ~ 2 often contain a small number of
extremely massive star-forming clumps. Resolution using adaptive optics
reveals that the clumps are undergoing extreme rates of star formation
[134].
Such rates may be difficult to achieve with purely gravitational
triggering as found in local star-forming galaxies.
Simulations suggest that such clumps, presumably formed by violent disk
gravitational instabilities, may generate outflows but survive for
 108
yr, long enough to fall into the central regions and contribute to bulge
formation and black hole growth
[135].
108
yr, long enough to fall into the central regions and contribute to bulge
formation and black hole growth
[135].
10.2. Evolution of early-type galaxies (ETG)
Isolated, early-type galaxies such as ellipticals and S0s, usually evolve in a passive way, with few signs of any on-going star formation. Such passive galaxies, however, are observed to grow in size. The mass-size relation of ETGs has been largely studied to probe their mass assembly history. The general picture is that the inner parts of ETGs form in situ after gas accretion and gas-rich mergers at z > 2, while the outer parts form via minor mergers at z < 2. Reference [136] used stellar kinematics measurements to investigate the growth of massive, quiescent galaxies from z ~ 2 to today, fig. 29. They found an inside-out growth of quiescent galaxies, consistent with expectations from minor mergers.
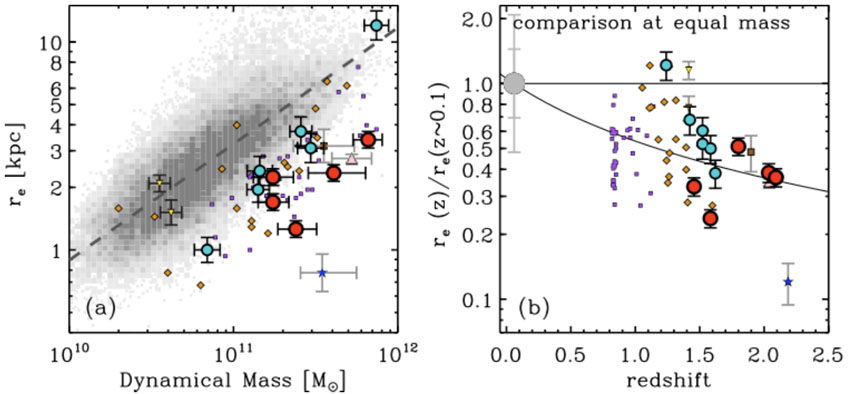 |
Figure 29. Evolution of the effective radius of passive galaxies with redshift. Left panel, size vs. dynamical mass: z ~ 2 galaxies (red circles) are smaller by a factor 3 compared to low-redshift galaxies. Right panel, evolution of the effective radius at fixed dynamical mass vs. redshift. The solid line is the best-fit re ≈ (1 + z)-0.97±0.10. Figure from [136]. |
Moreover, passive galaxies have been found to be larger in clusters than in the field. [137] studied the mass-size relation of quiescent massive ETGs living in massive clusters at 0.8 < z < 1.5, as compared to those living in the field at the same epoch. The authors find that ETGs in clusters are ~ 30-50% larger than galaxies with the same stellar mass residing in the field. They parametrize the size using the mass-normalized size, γ = Re / Mstar0.57, fig. 30. The size difference seems to be essentially driven by the galaxies residing in the cluster cores. They conclude that part of the size evolution is due to mergers: the observed differences between cluster and field galaxies could be due to higher merger rates in clusters at higher redshift.
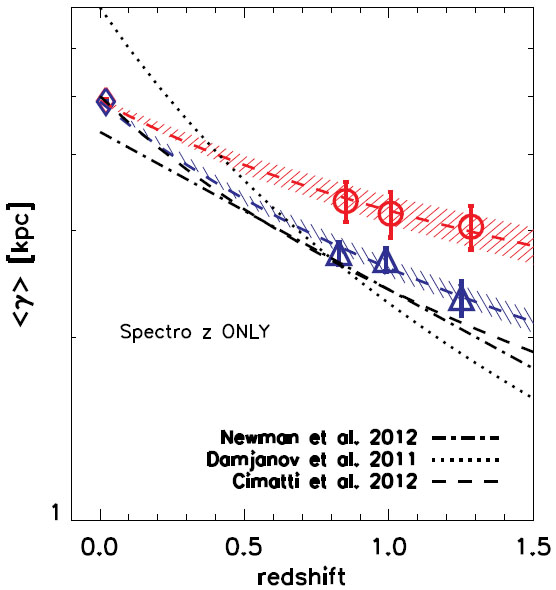 |
Figure 30. Evolution of
γ for passive ETGs with
log(M /
M |
10.3. Multiple stellar populations and the AGN connection
Recently,
[138]
studied several distant radio galaxies, and conclude that a single
stellar population is insufficient to fit their spectral energy
distributions. Instead, we have to simultaneously follow the passive
evolution of the galaxy as well as that of an on-going starburst to
explain the overall spectral energy distribution. Their best fits are a
sum of two evolving stellar populations, a recent starburst plus an old
population, fig. 31.
The two stellar components are a ~ 1011
M
starburst some ~ 30 Myrs after formation and an old, massive ~
1011-12
M
early-type galaxy population, formed ~ 1.0 Gyr previously. Comparable
masses may be in these two populations.
This finding suggests that most of the stellar population in high
redshift radio galaxies may be formed by massive starbursts in the early
universe, and the fact that similar characteristics have been found in
distant radio galaxies suggests that multiple stellar populations, one
old and one young, may be a generic feature of the luminous infrared
radio galaxy population.
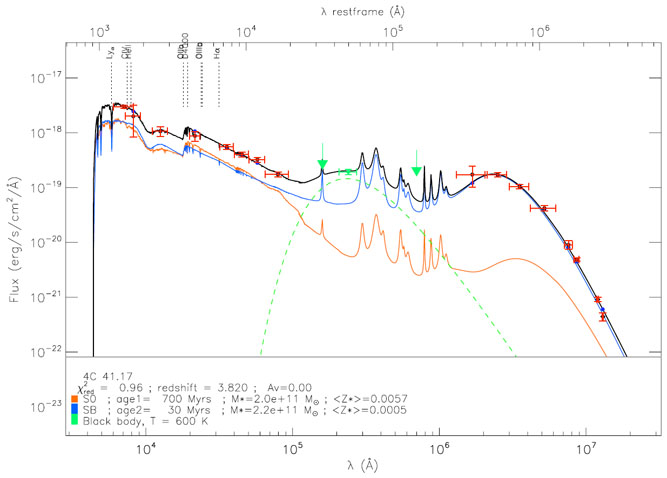 |
Figure 31. The spectral energy distribution of the radio galaxy 4C 41.17 (dots with red error bars) and its best fit (black line) obtained by the sum of the S0-type population evolution scenario at age of 0.7Gyr (orange line), an AGN model (green), and a starburst with an age of 30 Myrs after the initial 1 Myr duration burst (blue line) from a dense medium. Figure from [138]. The AGN model SED is from reference [141]. |
AGN generally have enhanced star formation [139]. This is usually interpreted as negative feedback, that is, the AGN are in the process of quenching star formation. Of course one might then expect that in non-AGN galaxies of similar stellar mass at high redshift, there should be even higher star formation rates. This is very difficult to establish if one uses AGN-selected samples.
The case for radio-jet induced positive feedback on star formation, presumably via pressurized cocoon formation, has been made in a study of the correlation of radio-selected AGN with host galaxy star formation rates. The presence of radio jets is found to correlate with enhanced star formation far more strongly than with x-rays from AGN [120].
It is possible that when positive feedback occurs, this is at such an early stage that the sources are Compton-thick to x-rays. Indeed [140] finds a high z ( ~ 4) example of a luminous AGN obscured in x-rays but detectable via both its AGN signature (rest- frame NIR emission by warm dust) and highly enhanced star formation (detectable by strong polycyclic aromatic hydrocarbon emission).
10.4. Specific star formation rate
Stellar masses and spectral energy distributions can be used to probe
the evolution of the specific star formation rate
( ∗
/ M∗). The observed sSFR
was originally thought to plateau at z
4, but after
correction for dust and nebula emission is now found to rise to z
~ 6 or beyond
[142].
∗
/ M∗). The observed sSFR
was originally thought to plateau at z
4, but after
correction for dust and nebula emission is now found to rise to z
~ 6 or beyond
[142].
A rising or declining star formation history seems to be preferred by the data [143]. Whether this is due to a process such as merging or quenching or to a more exotic means of triggering star formation cannot currently be ascertained.