Copyright © 2013 by Annual Reviews. All rights reserved
| Annu. Rev. Astron. Astrophys. 2013. 51:393-455
Copyright © 2013 by Annual Reviews. All rights reserved |


The practice of measuring SFRs from monochromatic indicators (and combinations thereof) is well established (see e.g., the reviews of Kennicutt 1998, Kennicutt & Evans 2012). A wide variety of relations have been established between SFRs and the UV, Hα, Pα, 24 μm luminosity, total IR luminosity, radio continuum luminosity, and even the X-ray flux. As they are not the focus of the present review, only a few brief remarks will be given regarding monochromatic SFR indicators. Each indicator is sensitive to a different SFR timescale, with ionizing radiation (as probed by e.g., the recombination lines) being sensitive to the shortest timescale, ~ 106 yr, and the UV and total IR being sensitive to longer timescales, e.g., ~ 108 yr. In detail, the UV and IR are sensitive to a range of SF timescales depending on wavelength and SFH. In the IR this sensitivity arises because shorter wavelengths are probing dust heated mostly by H ii regions, while FIR photons are sensitive to dust heated both by old and young stars. Amongst the recombination lines, `redder is better' since dust attenuation will be less severe at longer wavelengths, and so Pα should be preferred over Hα. For reference, an attenuation of 1 mag in the V-band implies an attenuation of only 0.15 mag at Pα, for standard attenuation curves. The optical and UV SFR indicators require correction for dust when used on their own. For this reason, mixed SFR indicators have become popular, usually via the combination of UV and IR or Hα and IR indicators (Calzetti et al. 2007, Kennicutt et al. 2007).
Estimating SFRs from SED fitting is very challenging for several reasons: (1) the age-dust-metallicity degeneracy makes it difficult to reliably measure ages and hence SFRs unless high quality data are available (see Section 6); (2) the choice of model priors on the dust model and SFH library imposes often severe biases on the resulting ages and SFRs. These difficulties were recognized early on in the study of high-redshift galaxies (Papovich, Dickinson & Ferguson 2001) and are still relevant today.
Brinchmann et al. (2004) measured SFRs for SDSS galaxies by modeling a suite of optical emission lines. Their model included variation in the total metallicity, dust attenuation, ionization parameter, and dust-to-metals ratio. As the SDSS is a fiber-based survey, these authors had to make a correction for the fact that the spectra sample only a fraction of the galaxy light. In addition, they modeled the stellar continuum in order to subtract off any absorption features under the emission lines. Salim et al. (2007) analyzed a comparably sized sample of z ~ 0 galaxies, focusing on UV photometry from the Galaxy Evolution Explorer (GALEX) and optical photometry from SDSS. These authors fit the data to SPS models with a range of SFHs (including exponentially declining SFHs and superimposed starbursts), metallicities, and dust attenuation. They presented a direct comparison between their SED-based SFRs and the emission line-based SFRs from Brinchmann et al. The result is shown in Figure 7. While the overall agreement is good there is a systematic trend with stellar mass resulting in offsets of ~ 0.2 dex at the low and high mass ends. Salim et al. explored the origin of this offset and concluded that the different derived dust attenuation optical depths between the two methods were the source of the discrepancy. They further speculated that in most cases it was the emission line-based dust attenuation values that were more accurate, and therefore also the SFRs. Salim et al. also demonstrated that for galaxies with low SFRs and/or galaxies with emission line ratios indicative of AGN activity, the UV-based SFRs tended to be more reliable than those estimated by Brinchmann et al. These results suggest that SFRs based on modeling UV-optical SEDs carry systematic uncertainties at the ≲ 0.3 dex level.
 |
Figure 7. Comparison between SFRs estimated from emission lines ("Hα"; Brinchmann et al. 2004) and from modeling the UV-optical SEDs (" UV"; Salim et al. 2007) of star-forming galaxies at z ~ 0. The right panel shows the difference between SFR estimators as a function of stellar mass. There is a systematic trend between the two estimators, which may be due to modeling differences and/or the uncertainty in extrapolating the fiber-based Hα SFRs to the total galaxy. From Salim et al. (2007). |
Wuyts et al. (2011) compared the SFRs of galaxies at z ~ 3 computed with three different techniques: Hα-based SFRs, SED-fitting based SFRs, and a mixed SFR indicator based on the UV and IR emission. For SFRs ≲ 100 M⊙ yr-1, these authors found that the three indicators agreed reasonably well (no systematic offsets were detected), provided that extra attenuation was included toward H ii regions when modeling the Hα-based SFRs. They also found that at the highest SFRs ≳ 100 M⊙ yr-1 the SED-based values tended to underpredict the SFR, compared to the mixed indicator (see also Santini et al. 2009). They argued that this was due to their assumption of a uniform dust screen, and at high column density this becomes an increasingly poor representation of reality.
At high redshift the effect of nebular emission lines becomes an additional source of systematic uncertainty in the modeling, and can significantly affect the best-fit SFRs. The impact of emission lines is larger at higher redshift because of three effects: (1) specific SFRs are higher; (2) metallicities are lower; and (3) the redshifting of the spectrum implies that a line of given EW comprises a larger fraction of the flux through a filter. In Figure 8 the specific SFR for galaxies with a mass of 109.5 M⊙ is shown as a function of redshift for various choices regarding the contribution of emission lines to the observed broadband fluxes. Evidently the inclusion or not of emission lines in the modeling can change the derived specific SFRs in a redshift-dependent manner, by a factor of roughly two in the most extreme cases (see also Pacifici et al. 2012, Labbe et al. 2012).
 |
Figure 8. Specific SFRs for galaxies with stellar masses of 109.5 M⊙ as function of redshift. The black and green symbols reflect different assumptions regarding the SFH (`REF', `RIS', `DEC' for constant, rising, and declining) and the correction for emission lines (`NEB'). Error bars reflect 68% confidence limits. From de Barros, Schaerer & Stark (2012) |
The mean stellar ages of galaxies are another important probe of the SFH. Of course, mass-weighted ages offer a direct probe of the integrated SFH, while light-weighted ages are more directly measurable from SEDs. Mass-weighted ages will always be larger than light-weighted ones, owing to the fact that young stars outshine older stars. As discussed further in the next section, the mass-weighted ages of actively star-forming galaxies turn out to be highly sensitive to the assumed model SFH used in the SED fitting. Due to the fact that light-weighting is highly non-linear, light-weighted ages computed from spatially resolved photometry will tend to be older than ages computed from integrated photometry, as demonstrated by Wuyts et al. (2011).
The mean ages of quiescent galaxies have been estimated largely via the modeling of spectral features, including Dn4000 and the Lick indices. A widely adopted procedure is to fit single-age SSPs to the Lick indices in order to estimate ages. In this approach it is the hydrogen Balmer lines that provide the primary constraint on the age, as these lines are strongest in A type stars and thus for populations with ages of ≈ 108 - 109 yr. The derived ages are sometimes referred to as `SSP-equivalent ages' in order to highlight the fact that no attempt is made to model composite stellar populations. A number of authors have demonstrated that these derived ages are lower limits to the true mass-weighted and light-weighted ages (Trager et al. 2000a, Serra & Trager 2007, Trager & Somerville 2009, MacArthur, González & Courteau 2009). As emphasized by Trager & Somerville (2009), this fact implies that any observed trend of SSP-equivalent ages with other parameters such as velocity dispersion will be stronger than the true underlying mass-weighted trend. The SSP-equivalent ages are younger even than light-weighted ages largely because of the sensitivity of the Balmer lines to ~ 1 Gyr old stars. Trager & Somerville (2009) concluded that SSP-equivalent ages are mostly measuring residual star formation over ~ 1 Gyr timescales.
These conclusions are not restricted to the analysis of spectral indices. Ferreras et al. (2009) estimated mean ages of early-type galaxies at z ~ 1 by fitting models to HST grism spectra. The ages estimated from single-age models showed almost no correlation with ages estimated with composite models. Likewise, MacArthur, González & Courteau (2009) performed full spectrum fitting on a sample of nearby galaxies and found only a modest correlation between ages derived from single-age models and light-weighted ages derived from composite models.
It is widely believed that the Hβ index is the ideal age indicator because it is largely insensitive to metallicity and abundance patterns (Worthey 1994, Tripicco & Bell 1995, Korn, Maraston & Thomas 2005). However, as noted by Worthey (1994) and later by de Freitas Pacheco & Barbuy (1995), Maraston & Thomas (2000), and Lee, Yoon & Lee (2000), the Balmer lines are also sensitive to the presence of blue HB stars, and there will therefore be some ambiguity in determining ages from Hβ without additional constraints on the presence of such stars. However, Trager et al. (2005) demonstrated that, while the inferred ages of the oldest stellar populations (≳ 10 Gyr) are susceptible to uncertainties of 2-5 Gyr due to the presence of blue HB stars, the ages of intermediate-age populations (~ 1-10 Gyr) are rather less affected by blue HB stars. The reason for this is that the Balmer lines increase so strongly with decreasing age that very large quantities of blue HB stars would be required to be present in old stellar populations to reproduce the high observed Hβ EWs. As an example, Thomas et al. (2005) found that they could reproduce the highest Hβ EWs in their sample with a model in which 50% of the old metal-rich stars had blue HB stars. In this two-component model, the component with blue HB stars needed to have a metallicity 0.2-0.4 dex higher than the other component. Percival & Salaris (2011) also found that models with very extreme HB populations and old ages could masquerade as a relatively young population with ages as young as ~ 3 Gyr, based on Hβ EWs. There is no compelling evidence supporting the existence of a population of blue HB stars in metal-rich quiescent galaxies large enough to explain the full range of Hβ EWs. However, it is reasonable to assume that there will be a population of blue HB stars in such systems, and they will affect the derived stellar ages.
The higher order Balmer lines are promising because they will be even more sensitive to warm/hot stars than Hβ. In principle then, the consideration of multiple Balmer lines should provide constraints on multiple age components, and/or allow for the separation of age and blue HB effects (Schiavon et al. 2004, Schiavon 2007, Serra & Trager 2007). However, the potential power of the higher-order Balmer lines is tempered by the fact that these features are more sensitive to metallicity and abundance ratios than Hβ (Thomas, Maraston & Korn 2004, Korn, Maraston & Thomas 2005). Schiavon (2007) analyzed the Hβ, Hγ, and Hδ indices measured from stacked SDSS early-type galaxy spectra with a variety of composite models including varying blue HB stars, blue stragglers, and multi-age populations. He concluded that small fractions of young/intermediate-age stellar populations, perhaps in the form of extended SFHs, was the most likely scenario to explain the observed trends. This proposal is similar, though not identical to the `frosting' of young stars proposed by Trager et al. (2000a) in order to explain the observed correlations between velocity dispersion, age, metallicity, and abundance pattern.
There exist other proposed methods for constraining multi-age components based on spectral indices. Rose (1984) proposed a Ca ii index that is sensitive to the Hє Balmer line. Leonardi & Rose (1996) demonstrated that this index in conjunction with Hδ can break the `age-strength degeneracy', referring to the age and strength of a recent burst of star formation. Smith, Lucey & Hudson (2009) used this diagnostic to argue against a frosting of small fractions of young stars (<1 Gyr) to explain the young apparent ages for quiescent galaxies in the Shapley supercluster. Kauffmann et al. (2003) considered both the Hδ and Dn4000 spectral features in an attempt to measure two-component SFHs (in particular, a burst of SF and an underlying τ model SFH). Galaxies with a sizable mass fraction formed in a recent burst of SF are significant outliers in the Hδ - Dn4000 plane, and so strong constraints on the burst fraction can be obtained in this way. Percival & Salaris (2011) argued that the Ca ii Rose index and the Mg ii feature near 2800 Å could also be used to separate age from blue HB effects.
Renzini & Buzzoni (1986) suggested that the onset of the AGB in ~ 0.1-1 Gyr old populations could be used to age-date galaxies in the NIR. Subsequent modeling efforts by Maraston (2005) confirmed that NIR spectral features attributable to oxygen-rich and carbon-rich AGB stars vary strongly over the age range ~ 0.1-1 Gyr, and may be used as an independent constraint on the presence of intermediate-age populations in galaxies. In principle, the very strong sensitivity of AGB evolution to mass (age) and metallicity suggests that they should be good clocks. However, their sensitivity to mass and metallicity is due to poorly understood physics, including convection and mass-loss, and so the calibration of an AGB-based clock is quite uncertain. Miner, Rose & Cecil (2011) attempted to use NIR spectral features to place constraints on the ages of M32 and NGC 5102 based on Maraston's models. They found broad qualitative agreement between NIR-based ages and CMD-based ages. Future quantitative modeling of the optical-NIR spectra will be required to assess the utility of AGB-sensitive spectral indices as age indicators.
Finally, it is also worth emphasizing that it is fundamentally very difficult to measure ages for systems older than ≳ 9 Gyr because evolution in the isochrones is so slow at late times. For example, at solar metallicity between 9-13.5 Gyr, the RGB changes by only ≈ 50 K while the main sequence turnoff point changes by ≈ 230 K. Very accurate models and very high quality data are required to be able to distinguish such small temperature variations. In theory the UV should be much more sensitive to age at late times due to the onset of an extended (blue) HB (Yi et al. 1999). In the context of a particular model, the UV colors become very sensitive to age for ages ≳7 Gyr. The problem with this chronometer is that it is very sensitive to the uncertain physical inputs, such as the mass-loss prescription and the helium abundance, and also to the underlying distribution of stellar metallicities (Yi, Demarque & Oemler 1997). These uncertainties will render absolute ages unreliable, although relative ages (or even simply the rank-ordering of galaxies by age) are probably more robust.
Papovich, Dickinson & Ferguson (2001) recognized that SED modeling suffered from a fundamental limitation, namely that the young stars, being so bright, tend to outshine the older, less luminous stars. This outshining effect was known to result in underestimated stellar masses when single-component SFH models are used (e.g., Papovich, Dickinson & Ferguson 2001, Daddi et al. 2004, Shapley et al. 2005, Lee et al. 2009b, Pforr, Maraston & Tonini 2012), but its effect on recovered SFRs and ages remained relatively less well-explored until recently. Lee et al. (2009b) analyzed the SEDs of high-redshift mock galaxies and concluded that the use of single-component exponentially-decreasing SFHs (τ models) resulted in substantially underestimated SFRs and overestimated mean ages (by factors of two for both parameters). They attributed this shortcoming to the fact that the mock galaxies tended to have rising SFHs in contrast to the declining model SFHs. Subsequent work by Lee et al. (2010), Maraston et al. (2010), Wuyts et al. (2011), and Pforr, Maraston & Tonini (2012) largely confirmed these findings, and further concluded that models with rising SFHs tended to provide a better fit to observed high redshift SEDs and produced SFRs in better agreement with other indicators. Relatedly, the choice of the allowed range of each SFH parameter (i.e., the prior) can significantly affect the inferred best-fit SFRs and ages (e.g., Lee et al. 2010, Wuyts et al. 2011).
A specific example of the effect of the adopted SFH parameterization on SFRs is shown in Figure 8. In this figure the specific SFR is shown as a function of redshift at a reference stellar mass of 109.5 M⊙. At high redshift the scatter between the "RIS", "DEC", and "REF" models is entirely due to the choice of the assumed SFH (rising, declining, or constant, respectively). At the highest redshifts these different choices result in a change in specific SFRs of more than an order of magnitude.
There has been some difference in opinion regarding which functional form one should adopt for the rising SFHs. Maraston et al. (2010), and Pforr, Maraston & Tonini (2012) advocated exponentially increasing SFHs while Lee et al. (2010) advocated delayed τ models of the form SFR∝ t e-t/τ. The data do not presently favor one functional form over the other. The basic conclusion to draw from these analyses is that the model SFH library must be sufficiently diverse to allow for a wide range in SFH types. Model SFHs that are too restricted will inevitably lead to biased results. Of course, the criterion for `sufficiently diverse' SFHs will depend on the galaxy type in question and has not been thoroughly examined in a general sense. At present, all that can be stated with confidence is that for certain SED types, especially highly star-forming galaxies, great care must be taken when constructing the model library of SFHs.
Another option is to use a library of SFHs drawn from semi-analytic or hydrodynamic models of galaxy formation. This technique was introduced by Finlator, Davé & Oppenheimer (2007), who analyzed SEDs of six high redshift galaxies with SFHs drawn from their hydrodynamic simulations. The advantage of this approach is that the model SFH library is more likely to contain realistic SFHs (with rising and falling SFHs, multiple bursts, etc.) than simple analytic models. Recently, Pacifici et al. (2012) explored a similar technique using SFHs from a semi-analytic model rather than a hydrodynamic simulation. The advantage of using a semi-analytic model is that a much larger range of SFHs can be computed in a given amount of computational time. As with any other SFH library, the results can be sensitive to the choice of priors. In this case, the `prior' is in some sense the reliability of the model in producing a realistic range of SFHs. A possible disadvantage of this approach is that it can be much more difficult to quantify the influence of this prior on the derived physical properties than when using analytic SFH libraries.
4.4. Non-Parametric Star Formation Histories
When modeling SEDs one typically must adopt some parameterization of the SFH, and it is this step that clearly introduces a number of poorly quantified systematics. An appealing solution to this problem is to model SEDs with non-parametric SFHs. This is precisely the approach taken by several groups, including MOPED (Heavens, Jimenez & Lahav 2000), STARLIGHT (Cid Fernandes et al. 2005), STECMAP (Ocvirk et al. 2006), VESPA (Tojeiro et al. 2007), ULySS (Koleva et al. 2009, and MacArthur, González & Courteau 2009). In the simplest implementation one specifies a fixed set of age bins and then fits for the fraction of mass formed within each bin. More sophisticated algorithms utilize adaptive age binning that depends on the SED type and S/N (e.g., Tojeiro et al. 2007). In all cases one is engaging in full spectrum fitting (in the restframe optical; for an example of the technique see Figure 9). In principle one could use such codes to fit broadband SEDs, but the fits would likely be seriously under-constrained. These methods have been tested in a variety of ways, and it appears that they are capable of recovering complex SFHs remarkably well, at least when the mock galaxies are built with the same SPS models as used in the fitting routines (Ocvirk et al. 2006, Tojeiro et al. 2007, Koleva et al. 2009). Not surprisingly, the requirements on the data quality are demanding: a wide wavelength coverage, high spectral resolution, and high S/N (typically > 50/Å) are required in order to robustly recover complex SFHs (Ocvirk et al. 2006, Tojeiro et al. 2007). In addition, there are clear systematics in the recovered SFHs due to different SPS models, particularly for the SFHs at ages of ~ 0.1-1 Gyr (Tojeiro et al. 2009, Tojeiro et al. 2011). This is perhaps related to the different treatment of AGB stars and/or core convective overshooting amongst SPS models. Moreover, current implementations of non-parametric SFH recovery utilize SPS models that only allow variation in metallicity and age — the abundance pattern is fixed to the solar value. When fitting to spectra this practice can introduce additional systematics since many of the features that are being fit are sensitive to the detailed abundance pattern of the system.
 |
Figure 9.Example fits to the optical spectrum of a quiescent and a star-forming galaxy with VESPA (Tojeiro et al. 2009). The SFHs are estimated non-parametrically with an age binning that is adaptive depending on the S/N and information content of the spectrum. The upper panels show the best-fits (red line is the model, black line is the data; emission lines have been excluded from the fits); lower panels show the recovered SFHs plotted as the mass fraction formed within each age bin. Figure courtesy of R. Tojeiro. |
There have been few comparisons between the SFHs derived via non-parametric methods with more conventional techniques. Tojeiro et al. (2009) compared SFRs estimated with VESPA to emission line-based SFRs from Brinchmann et al. (2004). No obvious discrepancies were found, but further detailed analyses would be desirable. Moreover, there appears to be no published work comparing the mean stellar ages (or some other moment of the SFH) between these various techniques.
4.4.1. SFHs from CMDs versus SFHs from Integrated Light. Ideally one would like an independent constraint on the SFH to compare against the SFH derived from integrated light spectra. Unfortunately no direct tests of this sort have been performed to date. The most robust method for determing SFHs is via the modeling of resolved color magnitude diagrams of the stars within galaxies. This technique is well-developed, and has recently been applied by Weisz et al. (2011) to a large sample of dwarf galaxies in the local volume compiled by the ACS Nearby Galaxy Treasury Survey (ANGST; Dalcanton et al. 2009). Leitner (2012) compared the SFHs derived by Weisz et al. (2011) to the SFHs derived from integrated light spectra by Tojeiro et al. (2009). The result is shown in Figure 10. The dwarf galaxies from the ANGST Survey have masses slightly lower than the lowest mass bin in the integrated light sample, and it is worth emphasizing that there is no overlap between the two samples. And yet, the dwarfs have SFHs comparable to the highest mass bin in the integrated light sample. There are many complications in making this comparison, not the least of which is the question of whether or not nearby dwarfs are representative of the cosmological average. Nonetheless, the difference in the qualitative trend derived from CMD-based and integrated light-based SFHs is striking and worthy of further study.
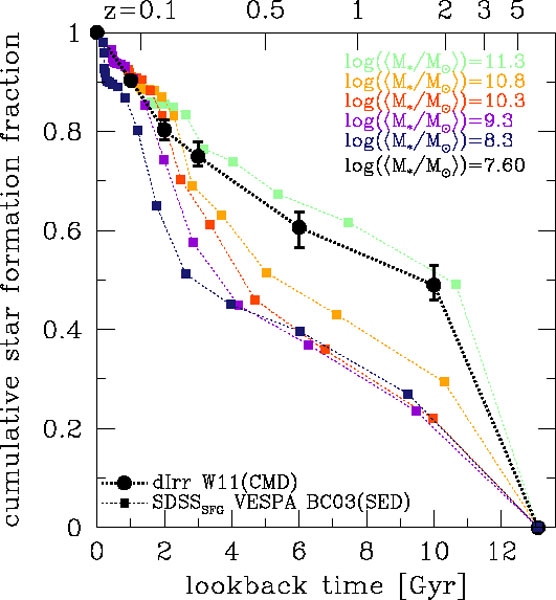 |
Figure 10. Comparison between SFHs estimated from integrated light SEDs to SFHs estimated from CMDs. The SED-based SFHs are based on SDSS spectra, as derived in Tojeiro et al. (2009), and binned by stellar mass. The CMD-based SFHs are from Weisz et al. (2011) based on data from the ANGST survey and are for low-mass dwarf irregulars. It is striking that the CMD-based SFHs for low-mass dwarfs look closer to the SED-based SFHs for the most massive galaxies. From Leitner (2012). |
Probing low levels of star formation in galaxies is challenging because at low levels classic SF indicators can become contaminated by other processes. At low luminosities, emission lines can be influenced by low-level AGN activity and they become difficult to measure on top of the strong absorption features in the continuum, dust emission can be due to heating from old stars (rather than tracing the formation of new stars), and ultraviolet light can be attributed to hot evolved low-mass stars. The former two indicators have been effectively abandoned as low-level SF indicators, while the third, UV light, still holds some promise.
It is beyond the scope of this review to discuss in detail the complications in interpreting UV (especially FUV) emission from predominantly quiescent systems, but a few remarks will serve to round out this section. The reader is referred to O'Connell (1999) for a thorough review, and Yi (2008) for a recent update. Low-level UV emission from galaxies can be due either to young massive stars or to hot evolved low-mass stars. In the latter category includes extreme HB stars, post-AGB stars, AGB-Manqué, etc. Extreme HB stars are known to exist in essentially all low metallicity and some high metallicity globular clusters. Post-AGB stars should exist at all metallicities, and AGB-Manqué are thought to occur only in special circumstances. It is very difficult to predict the specific numbers of these stars as a function of metallicity and time, and it is for this reason that low-levels of UV flux are so difficult to interpret. The recent catalog of evolved hot stars in Galactic globular clusters by Schiavon et al. (2012) may help to calibrate the models for these advanced evolutionary phases.
There have been several important developments since the review of O'Connell (1999), which are mainly due to progress provided by HST and GALEX. It is now clear that galaxies on the optically-defined red sequence (e.g., in B - V or g - r color space) frequently harbor low levels of star formation, at the rate of ~ 0.1-1 M⊙ yr-1 (Yi et al. 2005, Kaviraj et al. 2007, Salim & Rich 2010, Salim et al. 2012, Fang et al. 2012), although for the most massive galaxies SF levels appear to be even lower. The implication is that optical SEDs are not sensitive to specific SF at levels of ≲ 10-11 yr-1. It is also now quite clear that optically-defined red sequence galaxies have a wide range of UV colors, from those with low levels of star formation to those that are extremely red. It has become common practice to define an arbitrary UV-optical color boundary in order to separate star forming from quiescent galaxies (Yi et al. 2005, Jeong et al. 2009). Of course, such a practice does not provide an answer to the question of how low star formation rates actually are in the reddest galaxies. Instead it signals the difficulty in measuring SFRs for such red systems because any UV flux becomes easily confused with hot evolved low-mass stars. Further progress can be made by directly resolving luminous young stars and star clusters in nearby galaxies. This was precisely the strategy taken by Ford & Bregman (2012), who observed four nearby elliptical galaxies with HST. These authors argued that the galaxies in their sample have current specific SFRs in the range of 10-14 - 10-16 yr-1, far below what can be reliably probed via SED modeling. UV spectroscopic features may also aide in distinguishing hot evolved low-mass stars from hot upper main sequence stars (O'Connell 1999).
Measuring the detailed SFH of a galaxy from its observed SED is one of the holy grails of SPS modeling. Unfortunately, two unrelated physical effects make this task very difficult in practice: (1) high mass stars are so luminous that they dominate the SEDs of star-forming galaxies, easily outshining the more numerous, older, lower mass stars; (2) at late times isochrones evolve very little, so that it is difficult in practice to distinguish an ~ 8 Gyr population from a ~ 12 Gyr one. The first effect implies that light-weighted ages will always underestimate the true mass-weighted age. It also implies that the priors on the model SFHs can strongly influence the best-fit parameters. Non-parametric SFH reconstruction methods offer the best hope of providing unbiased results, but they require data of very high quality. As a general rule of thumb, optical SEDs are sensitive to specific SFRs as low as 10-11 yr-1, UV fluxes are sensitive to levels as low as 10-12 yr-1, while resolved UV photometry is in principle sensitive to specific SFRs down to at least ≲ 10-14 yr-1. SED-based SFRs are probably accurate at the factor of two level (at a fixed IMF), except for extreme systems where uncertainties can be much larger. There appears to be little consensus on the accuracy of light-weighted and mass-weighted stellar ages derived from SED fitting.