


The BLR has been studied extensively for over 30 years. Despite this long history, new surprises seem to emerge regularly. An important recent step has been the Sloan Digital Sky Survey, which is providing extremely large samples of AGNs for statistical study.
Probably the most obvious area of untapped potential remains reverber- ation mapping. Emission-line response times have been measured for only 35 AGNs; the response of the high-ionization UV lines has been measured in only in a bare handful of these cases, and only in the case of NGC 5548 have measurements been made on multiple occasions.
Most importantly, however, is that no reliable velocity-delay map has been obtained for any source. There have been attempts to recover velocity-delay maps from reverberation data, but in every case to date, the data have been of insufficient quality or quantity for this analysis. However, as a result of these pioneering observational studies, we understand the characteristics of AGN continuum and emission-line variability well enough that we can carry out fairly realistic simulations to determine what kind of data are necessary to recover a velocity-delay map. Extensive numerical simulations, e.g., [15], have shown the typical data requirements for a bright Seyfert galaxy (with specific numbers appropriate for the case of NGC 5548) are:
High time resolution (Δt ≈ 0.2–1.0 day). The time sampling of the light curves translates directly into the time resolution of the velocity-delay maps. Sampling as crude as ∼ 1 day provides around 4–20 resolution elements through the line response for a typical Seyfert galaxy, depending on the particular emission-line and on the luminosity of the source.
Long duration (several months). A rule of thumb in time series is that the duration of the experiment should be at least three times as long as the longest time scale phenomenon to be addressed. This suggests a minimum duration of some 60–80 days, again depending on the emission line and continuum luminosity. What simulations show is that the main requirement for detecting a clear reverberation signal is a major "event" in the driving light curve, i.e., an outburst, "drop-out," or change in the sign of the derivative. One needs to detect a strong signal and then follow it as it propagates through the entire BLR. Simulations based on the behavior of NGC 5548 suggest that a 200-day program is necessary for a high probability of success, but success can occur with programs as short as 75 days or so, if one is lucky.
Moderate spectral resolution (∼ 600 km s-1). Spectral resolution translates directly into velocity-resolution in the velocity-delay map. Resolution of R > 500 typical yields some 10 or so resolution elements across a typical broad emission line. Given the lack of profile structure at high spectral resolution, resolution approaching the thermal line width (i.e., R ≈ 30,000) does not seem necessary.
High homogeneity and signal-to-noise ratio (S/N ≈ 100). A high level of homogeneity and high signal-to-noise ratios per datum are required in order to detect the continuum variations, usually a few percent or less between observations, and the responding signal in the emission lines. At least high relative photometric accuracy is required; this is a major challenge to ground-based observations where one has little control over the point-spread function, which ultimately limits the photometric accuracy. For this reason and that some of the most responsive emission line are in the UV, space-based observations are preferred for obtaining velocity-delay maps.
Detailed simulations show that Hubble Space Telescope can carry out such a project, but practically speaking, only for a limited number of emission lines. To get a complete map of the BLR, it is desirable to use as many lines as possible; this is especially important if the BLR is, as suggested earlier, a composite structure such as a disk plus a disk wind. A space mission concept, called Kronos, has been designed to obtain spectroscopic time series data on accretion-driven sources, with the specific application of obtaining velocity-delay maps of the BLR as a major goal. The key to Kronos science is long on-target times at high time resolution, enabled by long on-target times as a consequence of its high-Earth orbit (P ≈ 14 days).
Figure 12 shows an example of a reverberation-mapping simulation. The BLR model in this case is an inclined (i = 45°) Keplerian disk with a somewhat arbitrary spiral-arm structure. The emission-line response for each of four strong lines is calculated from a photoionization equilibrium model based on NGC 5548. The recovered velocity-delay maps are based on the quality and quantity of data expected from the Kronos spectrometers.
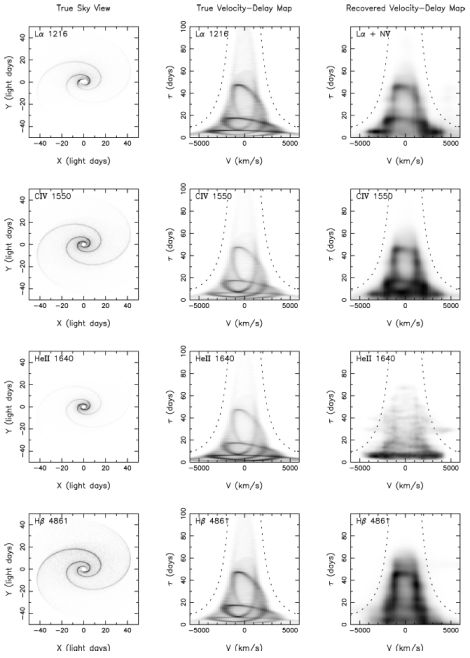 |
Figure 12. Reverberation mapping simulations. From left to right, the three columns show, for four emission lines, (a) a map of a BLR with a spiral arm structure in configuration space, (b) a corresponding velocity-delay map, and (c) a velocity-delay map recovered from simulated data. From top to bottom, the rows represent results for Lyα λ1216, C IV λ1550, He II λ1640, and Hβ λ4861. From [15] |