


Before considering their detailed properties, it is important to start by defining radio AGN as a class. One approach is to use the shapes of the AGN spectral energy distributions (SEDs), for example defining radio AGN to have a minimum ratio of radio to optical luminosity (e.g. R = L5 GHz / LB > 10: Kellermann et al., 1989). However, the disadvantage of this method is that the optical AGN luminosity estimates may be affected by dust obscuration — a particular problem for narrow-line AGN — and contamination by the direct starlight of the host galaxies. There is also evidence that the radio-to-optical luminosity ratio that defines the boundary between radio-loud and radio-quiet AGN increases substantially towards low AGN luminosities and Eddington ratios (Sikora, Stawarz & Lasota, 2007, Chiaberge & Marconi, 2011). Use of a mid-IR-to-radio flux ratio (e.g. q24 = L24 µm / L1.4 GHz: Appleton et al., 2004, Ibar et al., 2008) would avoid the extinction problem; however, in this case there is the potential for strong contamination of the mid-IR luminosities by star formation in the host galaxies.
An alternative to the SED-based approach is to use a single radio power cut above which an AGN can be considered as radio-loud. This is the approach adopted for this review: I define a radio AGN to have a monochromatic radio luminosity measured at 1.4 GHz of L1.4 GHz > 1024 W Hz−1. Although this cut may seem arbitrary given that the general population of AGN shows a continuous range of radio power, it does have some physical basis in the sense that the populations of objects in the local universe that are generally considered radio-quiet in terms of AGN properties, such as starburst galaxies and classical, UV-selected Seyfert galaxies, have steeply declining luminosity functions above L1.4 GHz = 1023 W Hz−1; such objects are rare above L1.4 GHz = 1024 W Hz−1 (Meurs & Wilson, 1984, Condon, 1989, Sadler et al., 2002).
In what follows I will also sometimes draw a distinction between luminous, quasar-like AGN and their less luminous counterparts. Originally quasars were defined by their star-like appearance in optical images. However, with the detection and characterisation of the underlying host galaxies, it has become clear that quasars represent the higher luminosity end of a general AGN population that shows a continuous range of luminosities. Here I define quasars to have bolometric luminosity Lbol > 1038 W. Roughly, this corresponds to 2 – 10 keV X-ray luminosities LX−ray > 1037 W, optical absolute magnitudes MB < −23 and optical [OIII] λ5007 emission line luminosities L[OIII] > 1035 W, depending on the precise SEDs and bolometric correction factors assumed. However, I will not distinguish between broad-line radio galaxies (BLRG: see below for description) and radio-loud quasars, because there is a significant overlap in the properties of these two groups, and some BLRG show evidence for relatively high levels of dust extinction (e.g. Osterbrock, Koski & Philips, 1976) consistent with them being partially obscured quasars; I will refer to these objects collectively as BLRG/Q sources, but they also sometimes labelled broad-line objects (BLO).
In many sciences, including astronomy, the classification of a phenomenon often precedes its interpretation in terms of the underlying mechanisms. Faced with a diverse phenomenon, the process of classification is an attempt to sort things out, a first step in elucidating underlying patterns of behaviour. While the classifications themselves remain relatively fixed, their interpretation in terms of the underlying physical processes, structures, geometries etc. may not be unique and may change with time. For these reasons it is important to keep the classifications separate from the interpretations. In this sub-section I summarise the radio and optical classifications of radio AGN; possible interpretations are then discussed in the following sub-sections. For ease of reference, the labels used to classify radio AGN are summarised in Table 2.
| Abbr. | Meaning | Ref |
| NLRG | Narrow-line radio galaxy | 1 |
| BLRG | Broad-line radio galaxy | 2 |
| WLRG | Weak-line radio galaxy | 3 |
| SLRG | Strong-line radio galaxy | 4 |
| Quasar | Quasi-stellar radio source | 5 |
| LEG | Low-excitation galaxy | 6 |
| HEG | High-excitation galaxy | 6 |
| ELEG | Extreme low-excitation galaxy | 6 |
| BLRQ/Q | Broad-line radio galaxy or quasar | 7 |
| BLO | Broad-line object | 6 |
| OVV | Optically violently variable (quasar) | 8 |
| FRI | Fanaroff-Riley class I source | 9 |
| FRII | Fanaroff-Riley class II source | 9 |
| FR0 | Fanaroff-Riley class 0 source | 10 |
| FSRQ | Flat-spectrum radio-loud quasar | 11 |
| SSRQ | Steep-spectrum radio-loud quasar | 11 |
| CSS | Compact steep spectrum radio source | 12 |
| GPS | Gigahertz-peaked radio source | 13 |
| FD | Fat-double radio source | 14 |
| RD | Relaxed-double radio source | 15 |
| Reference key: 1. Costero & Osterbrock (1977); 2. Osterbrock, Koski & Philips (1976); 3.Tadhunter et al. (1998); 4. Dicken et al. (2014); 5. Schmidt (1963); 6. Buttiglione et al. (2010); 7. Dicken et al. (2009); 8. Penston & Cannon (1971); 9. Fanaroff & Riley (1974); 10. Ghisellini (2011); 11. Urry & Padovani (1995); 12. Fanti et al. (1990); 13. O'Dea, Baum & Stanghellini (1991); 14. Owen & Laing (1989); 15. (Leahy, 1993). Note that LEGs and HEGs are sometimes labelled LERGs (low excitation radio galaxies) and HERGs (high excitation radio galaxies) in the literature. | ||
An interesting feature of classification in astronomy is that a particular object may me classified in different ways at different wavelengths. For radio AGN some of the greatest insights have been obtained when attempting to understand the relationships between their classifications at the different wavelengths. The main radio and optical classifications of radio AGN are illustrated in Figure 1.
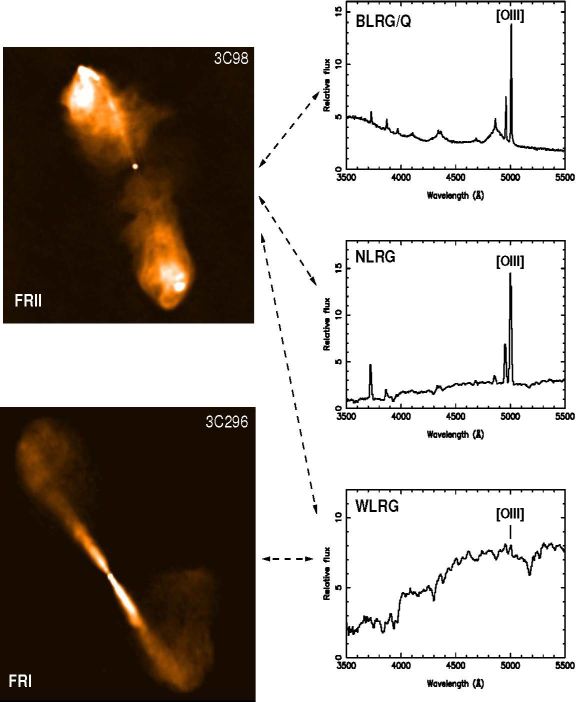 |
Figure 1. The main radio and optical classifications of radio AGN. Left: radio morphological classifications. Right: optical spectroscopic classifications. The dashed lines indicate links between the radio and optical classifications. Credits: the radio images were taken from http://www.jb.man.ac.uk/atlas. |
The radio classification of radio AGN followed the development of large radio interferometers in the 1970s that were able to map the extended radio-emitting structures in some detail. It was found that extragalactic radio sources are generally double in character, with synchrotron-emitting lobes that sometimes contain compact higher surface brightness concentrations called hot spots, connected to radio cores sources in the nuclei of the galaxies by jets (e.g. Miley, 1980). The radio structures often extend on scales that are larger than the host galaxies (∼50 kpc to 1 Mpc).
One of the main radio morphological classifications is that of Fanaroff & Riley (1974), who divided objects according to whether the distance between the highest surface brightness extended radio features on either side of the nucleus was more or less than 50% of the total diameter of the radio source, corresponding to the FRII and FRI classifications respectively (see Figure 1 for examples). Fanaroff & Riley showed that the FRII sources have higher radio powers on average than FRI sources, with the division between the two types occurring at a radio power of L178 MHz ∼ 1026 W Hz−1 (or L1.4 GHz ∼ 3 × 1025 W Hz−1). However, it was already recognised by Fanaroff & Riley that a minority of sources (∼17% in their sample) could not be unambiguously assigned to either the FRI or the FRII class. Certainly, with the higher resolution radio maps available since the early 1980s it has become clear that some sources have an apparently hybrid FRI/FRII character (see the example of Hercules A in Figure 10). Also, the radio power division is not sharp: some sources with an FRII morphology have radio powers well below L178 MHz = 1026 W Hz−1, and vice versa. Some ambiguity in this classification may be caused by the fact that, with the availability of higher resolution radio maps, the original quantitative criterion of Fanaroff & Riley has often been replaced by a subjective assessment of whether the morphology of a source appears “edge brightened” or “edge darkened”.
Although the FRI/FRII classification is the most common, other radio morphological classifications are also used 2. For example, some radio sources resemble double-lobed, edge-brightened FRII sources, with similar steep-spectrum radio synchrotron emission, but have much smaller linear diameters. The class of compact steep-spectrum (CSS) sources has been defined (see Fanti et al., 1990, O'Dea, 1998) to include steep spectrum radio sources with total diameters D ≤ 20 kpc. Further diversity in the radio classification is added by objects that, rather than showing the classical double-lobed morphology, exhibit a core-jet or core-halo structure (e.g. Antonucci & Ulvestad, 1985a). Finally, some extended double-lobed radio sources have been classified as “fat doubles” (FD) based on the fact that their lobes are unusually extended in the direction perpendicular to the axis defined by the radio jets (Owen & Laing, 1989). Such sources are also sometimes labelled “relaxed doubles” (RD) on the basis that their radio lobes lack bright hotspots and jets (Leahy, 1993). However, both the fat and the relaxed classifications lack clear, quantitative definitions.
In addition to the morphological classifications, radio sources are also classified on the basis of their long wavelength SED shapes, often quantified in terms of the spectral index (α) of a power law fitted to their radio spectra when expressed in frequency units (Fν∝ ν−α). Flat- and steep-spectrum radio sources are defined to have spectral indices smaller or greater than a particular limiting value (typically αlim ∼ 0.5, but definitions vary). It is notable that, whereas steep-spectrum radio sources are commonly associated with FRI, FRII or CSS radio morphologies, flat-spectrum sources are generally core dominated, appearing as core-jet or core-halo sources in high resolution very long baseline interferometry (VLBI) observations (e.g. Antonucci & Ulvestad, 1985a). However, some radio sources have more complex radio spectra that cannot be approximated using a simple power-law fit. In particular, the GHz-peaked sources (GPS) have radio spectra that peak at GHz frequencies and decline at higher and lower frequencies (Bolton, Gardner & Mackey, 1963); such spectra are often attributed to synchrotron self-absorption effects (Kellermann, 1966). Morphologically, GPS sources often show double-lobed radio structures that are even more compact (D ≤ 1 kpc) than those of CSS sources 3
Most optical classifications of radio AGN rest on their emission line properties. In the 1970s Osterbrock and colleagues identified a host of narrow emission lines in several radio galaxies that they used to measure key properties of the narrow line region (NLR) such as reddening, density and temperature (e.g. Osterbrock & Miller, 1975). Paralleling the classification of Seyfert galaxies into Seyfert type 1 and Seyfert type 2, based on respectively the presence or absence of broad (FWHM > 2000 km s−1) permitted lines in the spectra (Khachikian & Weedman, 1971), they also divided the radio galaxies into two types: broad-line radio galaxies (BLRG Osterbrock, Koski & Philips, 1976) and narrow-line radio galaxies (NLRG: Costero & Osterbrock, 1977), with BLRG showing spectral similarities to quasars, but having less luminous AGN. Collectively the NLRG and BLRG/Q spectroscopic classes can be labelled as strong-line radio galaxies (SLRG).
By the late 1970s, however, it became clear that the NLRG/BLRG/Q classification does not capture the full spectral diversity of the radio AGN population: in a study of 3CR radio galaxies Hine & Longair (1979) recognised a new class of objects (labelled “Class B”) that have “only the absorption spectra typical of giant elliptical galaxies or else very weak [OII] λ3727”. Understanding these objects, and how they relate to the SLRG, has been a major focus of research on radio AGN in the last 20 years; over this period improved spectroscopic data has allowed more quantitative classification schemes to be developed. Such objects are now identified in samples of radio AGN on the basis of their low [OIII] λ5007 equivalent widths (e.g. the weak-line radio galaxy [WLRG] classification of Tadhunter et al. 1998) or their low excitation/ionization emission line spectra (e.g. the low excitation galaxy [LEG] class of Buttiglione et al. 2010), or one or other of [OIII] equivalent width and excitation/ionization criteria (Laing et al., 1994, Jackson & Rawlings, 1997, Best & Heckman, 2012).
The different methods used to classify the Class B/WLRG/LEG objects have the potential to lead to ambiguity. Fortunately, most objects classified as WLRG on the basis of their low equivalent width [OIII] emission would be also be classified as LEG on the basis of the low excitation/ionization of their emission line spectra, as quantified using emission line ratios and diagnostic diagrams. Indeed, the [OIII] equivalent width is strongly correlated with excitation/ionization state in the radio AGN population (see Figure 1 of Best et al. 2012). However, the LEG and WLRG classifications are not exactly the same, and a minority of objects classified as LEG are not classified as WLRG. For example, in the study of Buttiglione et al. (2010) a few of the objects classified as LEGs on the basis of their low excitation/ionization emission line spectra have relatively strong, high equivalent width [OIII] emission lines (e.g. 3C84 4, 3C153, 3C196.1, 3C349).
The data in Buttiglione et al. (2009, 2011) can be used to make a more quantitative comparison between the classification schemes. Taking the 99 3CR radio AGN with redshifts z < 0.3 in the Buttiglione et al. (2010, 2011) study with secure spectroscopic classifications, 2% are classified as star forming objects, 46% as LEGs 5, 33% as high excitation galaxies (HEGs), and 18% as broad line objects (BLOs). In comparison, according to the WLRG/NLRG/BLRG/Q classification scheme of Tadhunter et al. (1998), 32% of the same objects would be classified as WLRG, 48% as NLRG and 19% as BLRG/Q objects. Overall, 65% of the 43 objects classified as LEGs by Buttiglione et al. would be classified as WLRG based on their [OIII] equivalent withs.
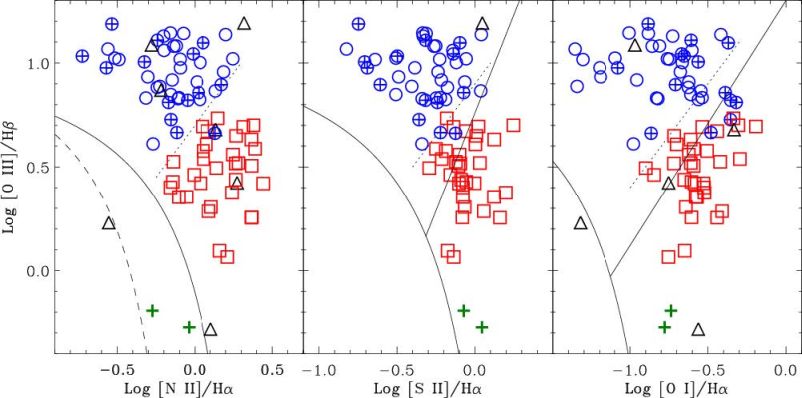 |
Figure 2. Emisssion line ratio diagnostic diagrams for 3CR radio galaxies from Buttiglione et al. (2010). In all of the diagrams the blue circles indicate HEGs, the red squares LEGs, the green crosses objects in which the ionization of the NLR gas has a significant contribution from stellar photoionization, and the black triangles indicate objects that lack measurements of one of the diagnostic ratios. The dotted line indicates the division between LEGs and HEGs, and the curved black line shows the division between AGN and star forming galaxies. In the [NII] / Hα vs [OIII] / Hβ diagram the area between the curved solid and dashed lines indicates the region containg objects with composite AGN/stellar photoionization spectra, while the inclined solid black lines in the other two diagrams indicate the division between Seyfert galaxies and LINERs (from Kewley et al., 2006). Credits: this figure was originally published as Figure 7 in Buttiglione et al. (2010). |
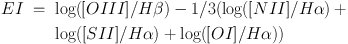
An advantage of the Buttiglione et al. (2010) scheme is that it is based on a clear, quantitative criterion that is motivated by the positions of the points on emission line diagnostic diagrams (see Figure 2). In this scheme LEGs and HEGs are classified according to their excitation indices (EI):
 |
(1) |
where [OIII] / Hβ represents the ratio of the flux of the [OIII] λ5007 line to that of the Hβ line, while [NII] / Hα, [SII] / Hα and [OI] / Hα represent respectively the ratios of the fluxes of [NII] λ6583, [SII] λλ6717,6731 and [OI] λ6300 lines to that of Hα; LEGs are defined to have EI < 0.95 6, while HEGs are defined to have EI > 0.95. Importantly, there is evidence that the distribution of excitation class in the sample is bimodal, with one peak representing the HEGs/BLO and the other the LEGs. However, a disadvantage of this method is that it requires accurate measurements of all the lines involved in the excitation index. For objects at the lower end of the [OIII] equivalent width (EW) distribution this information is difficult to obtain, since several (or all) of the emission lines are undetected or have flux measurements with large uncertainties. For this reason, 14 (12%) of the 113 3CR objects with redshifts z < 0.3 in the full sample of Buttiglione et al. (2010, 2011), lack spectroscopic classifications. The latter objects would be classified as WLRG in the Tadhunter et al. (1998) scheme, leading to 43% of the full sample of Buttiglione et al. (2009, 2010, 2011) being classified as WLRG.
Therefore a major advantage of the alternative technique of using an upper limiting [OIII] EW is that it captures the objects with low EW or undetected [OIII] that cannot be classified on the basis of excitation class. On the other hand, using a particular [OIII] equivalent width limit (EW[OIII] < 10 Å in the case of Tadhunter et al. 1998) is somewhat arbitrary because, while there is some evidence for bi-modality in the [OIII] emission line luminosities and equivalent withs for the high radio power end of the 2Jy sample, at low radio powers the distribution [OIII] equivalent widths appears continuous. Also, the equivalent width of [OIII] depends not only on the [OIII] emission line flux but also on the flux of the underlying stellar continuum. The latter may vary from object to object (for a given [OIII] luminosity), and be subject to aperture and reddening effects.
An important general point about the LEG and WLRG classes is that, while their emission line ratios are similar to the those of the LINER class of radio-quiet AGN (Heckman, 1980), there are differences in terms of emission line luminosity. As pointed out by Capetti et al. (2013), many of the LEGs in the 3CR sample have emission line luminosities that are comparable with those of Seyfert galaxies, but much higher than those of LINERs; the same is true of many of the 2Jy radio AGN classified as WLRG by Tadhunter et al. (1998).
One further classification method is based on optical variability. A subset of objects — labelled blazars — exhibit extreme variability at optical wavelengths. This class includes BL Lac objects and optically violently variable (OVV) quasars, with the two groups separated on the basis that BL Lac objects show emission lines that are weak relative to the underlying featureless continuum (e.g. EW < 5Å : Urry & Padovani 1995), whereas OVV quasars exhibit broad emission lines as well as a strong non-stellar continuum; a relatively high degree of optical polarisation is also common in both of the latter groups. Moreover, most such objects are flat-spectrum radio sources with core/halo or core/jet morphologies.
Finally, it is important to consider the degree to which the various optical and radio classifications are correlated. Table 3 shows the frequency of the different optical spectroscopic classifications for FRI, FRII, CSS/GPS, and hybrid FRI/FRII or uncertain radio morphological classifications in both the full z < 0.3 3CR sample of Buttiglione et al. (2009, 2011: 113 objects) and the full z < 0.7 2Jy sample of Tadhunter et al. (1998: 66 objects) 7. The most striking feature of this comparison is that all the objects unambiguously classified as FRI radio sources are WLRG; none are classified as BLRG/Q 8. In addition, all SLRG have FRII or CSS/GPS radio morphologies, apart from a small minority that have hybrid FRI/FRII or ambiguous morphologies. It is also clear that, while the majority of FRII sources are SLRG, a significant minority (∼ 24%) are WLRG.
| Type | Sample (N) | %WLRG | %NLRG | %BLRG/QSO |
| FRI | 3CR (22) | 100 | 0 | 0 |
| 2Jy (15) | 100 | 0 | 0 | |
| FRII | 3CR (78) | 24 | 54 | 21 |
| 2Jy (39) | 23 | 41 | 36 | |
| CSS/GPS | 3CR (4) | 25 | 75 | 0 |
| 2Jy (7) | 0 | 71 | 29 | |
| FRI/FRII | 3CR (5) | 60 | 40 | 0 |
| 2Jy (4) | 100 | 0 | 0 | |
| Other | 3CR (4) | 25 | 25 | 50 |
| 2Jy (2) | 0 | 0 | 100 | |
2.2. Orientation-based unification I: SLRG
The orientation-based unified schemes were developed following the recognition in the late 1970s and early 1980s that the continuum emission from AGN is highly anisotropic. In the case of radio AGN, there are two types of anisotropy to consider. First, the beaming of the non-thermal synchrotron emission due to the bulk relativistic motions of the jets in the core regions of the sources. Direct evidence for the bulk relativistic motions and beaming is provided by the detection of apparently superluminal velocities in VLBI observations of the radio cores of blazar-like objects (Cohen et al., 1977), and the detection of a polarisation asymmetries in the radio lobes of radio-loud quasars that correlate with sidedness of the inner radio jets (Garrington et al., 1988, Laing, 1988). Second, the blocking effect of dust and gas in the circum-nuclear dust structures that are often characterised as tori. The presence of this form of anisotropy is supported by detection of significant optical polarisation that is aligned perpendicular to the radio axes in nearby radio galaxies (Antonucci, 1982, Antonucci, 1984), the detection of broad emission lines in the polarised intensity spectra of nearby Seyfert galaxies and NLRG (Antonucci, 1984, Antonucci & Miller, 1985b, Ogle et al., 1997, Cohen et al., 1999), and the detection of “ionisation cones” in narrow-band emission line images of Seyfert galaxies (e.g. Pogge, 1988, Tadhunter & Tsvetanov, 1989b) and radio galaxies (Jackson, Tadhunter & Sparks, 1998). The effect of such blocking is to heavily attenuate both the continuum and broad line region (BLR) emission of the AGN at UV and optical wavelengths in objects for which the radio jet/torus axis is pointing at a large angle to the line of sight.
The anisotropic AGN continuum emission can help to explain some of the observed diversity in the properties of the radio AGN. Perhaps the most ambitious anisotropy-based unified scheme for radio AGN involves both forms of anisotropy, and attempts to explain the relationship between steep-spectrum radio-loud quasars (SSRQ), flat-spectrum radio-loud quasars (FSRQ), and radio galaxies, (Barthel, 1989). This scheme is shown schematically in Figure 3(a). The basic idea is that, for a given radio power, the different classes of radio sources are all drawn from the same parent population with similar central AGN properties, and the differences between their radio and optical properties are explained in terms of anisotropy and orientation. In this scheme, the relative proportions of FSRQ, SSRQ/BLRG and NLRG in a particular radio AGN sample is set by the opening half-angles of both the torus (θtor) and the beaming cones of the relativistic jets (θbeam ∼ Γ−1, where Γ is the Lorentz factor of the bulk relativistic motions in the jet). Recent analysis of the radio and optical properties of the HEG and BLO with FRII morphologies in the z < 0.3 3CR sample is consistent with θtor = 50 ± 5 degrees and Γ ∼ 3 — 5 (Baldi et al., 2013).
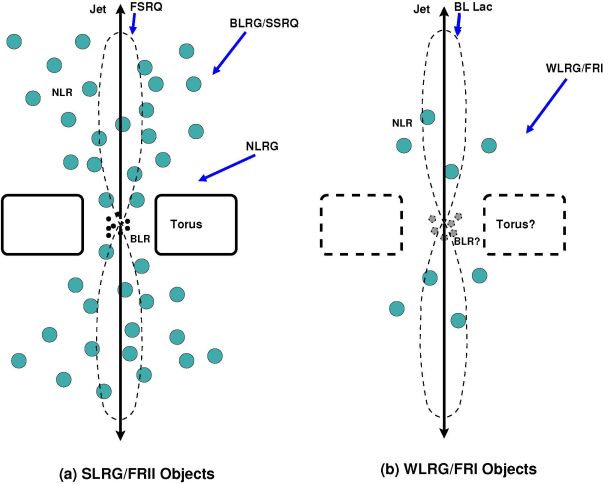 |
Figure 3. Schematic showing the main elements of the orientation-based unified schmes for (a) SLRG/FRII objects, and (b) WLRG/FRI objects. The blue solid arrows indicate the directions from which different classes of objects might be observed, while curved dashed lines indicate the polar diagram of the beamed radio jet emission; narrow-line region (NLR) clouds are indicated by turquoise circles. |
One way to test such schemes is to compare the statistical properties of the different classes of radio AGN in flux-limited samples selected in well-defined redshift/radio luminosity ranges. For example, Barthel (1989) compared the distributions of the measured (i.e. projected) linear sizes of the radio sources of the radio galaxies and the quasars in his sample of intermediate- to high-redshift (0.5 < z < 1) radio galaxies, and found that the radio galaxies have larger diameter radio sources on average than the quasars, as expected in the case that we have a foreshortened view of the radio sources of the quasars. However, attempts to repeat the linear diameter test on other samples of radio sources, albeit samples selected in different redshift ranges and/or with different radio flux limits, have failed to find significant differences between the linear size distributions of radio galaxies and quasars (Singal et al., 1993, Kapahi et al., 1995). Note that, this lack of difference between the linear size distributions is not necessarily evidence against the orientation-based unified schemes, but could rather reflect selectional biases in the samples, incompleteness in the optical classifications of the targets, mixing up different populations of radio sources, or the effects of the radio power evolution of the sources coupled with a luminosity dependence in the opening angle of the torus (e.g. Gopal-Krishna, Kulkarni & Wiita, 1996).
Another statistical test involves comparing the radio powers of the extended radio lobes of powerful radio galaxies and quasars. In this case, since the radio lobes are not thought to be undergoing bulk relativistic motions that would cause anisotropy in their radio emission, we would expect the radio galaxies and quasars to have similar distributions of lobe power. In general, this is borne out by the observations (e.g. Urry & Padovani, 1995). Clearly, a major advantage of radio AGN for tests of the unified schemes is the isotropy of the emission from their radio lobes: samples selected on the basis of their low frequency radio emission — assumed to be lobe-dominated — can be considered orientation-independent.
The recent dramatic improvement of the optical and infrared data for samples of nearby radio sources has also allowed tests of orientation-based unification based on the optical and mid-IR emission lines and mid-IR continuum: if BLRG/Q and NLRG objects are drawn from the same parent population, on average the two groups should show similar luminosities in their narrow emission lines and mid-IR continua, assuming that the latter are emitted isotropically (i.e. they do not suffer attenuation by the circum-nuclear dust).
As one of the brightest optical emission lines that represents the high ionization conditions typical of the NLR, the [OIII]λ5007 forbidden line was the first to be used in this way. Early results suggested that the quasars are up to an order of magnitude more luminous in [OIII] than NLRG (Jackson & Browne, 1990). In contrast, the lower ionisation [OII] λ3727 line — which is likely to be emitted on larger scales than the [OIII] — showed no significant difference between the two groups (Hes, Barthel & Fosbury, 1993). Therefore, rather than providing evidence against the unified schemes, it was proposed that all, or part, of the [OIII]-emitting NLR is emitted on a relatively small scale and is subject to attenuation by the circum-nuclear dust in NLRG. This is supported by the observation of variability in the [OIII] emission lines of the BLRG 3C390.3, which provides evidence that much of the [OIII] emission in that object is emitted on a scale r < 10 pc (Clavel & Wamsteker, 1987, Zheng et al., 1995). However, some of the early studies that compared the [OIII] emission line luminosities of radio galaxies and quasars failed to distinguish between WLRG and SLRG. If WLRG represent a separate class of radio AGN with intrinsically lower luminosity AGN (see discussion in section 2.4 below), this could lead to the apparent differences between the [OIII] luminosities of narrow- and broad-line objects being exaggerated (Laing et al., 1994).
Deep mid-IR spectroscopy observations taken with the IRS spectrograph on the Spitzer satellite have deepened our understanding of the degree of attenuation suffered by the [OIII] narrow line and the mid-IR continuum emission (Haas et al., 2005, Dicken et al., 2014). Figure 4 shows example Spitzer/IRS spectra for radio AGN from the 2Jy sample and illustrates the diversity in the mid-IR spectra of radio AGN. Such observations have enabled accurate measurements to be made of the mid-IR [NeIII] λ15.6µm and [OIV] λ25.9µm fine structure lines, which are much less likely to suffer dust extinction than the optical forbidden lines. Figure 5 shows the [OIII] emission line and 24µm continuum luminosities plotted against the [OIV] λ25.9µm luminosity for complete sub-samples of 3CRR and 2Jy SLRG, with NLRG and BLRG/Q indicated by different symbols. It is clear that, on average, the NLRG fall below the correlations defined by the BLRG/Q. Under the reasonable assumption that the [OIV] emission is not significantly attenuated, this suggests that both the [OIII] and 24µm emission suffer a similar mild attenuation by factor of ∼2 — 3 (Dicken et al., 2014) 9. This is similar to the level of [OIII] extinction deduced by Baum et al. (2010) and LaMassa et al. (2010) for samples of nearby Seyfert 2 galaxies using Spitzer/IRS data.
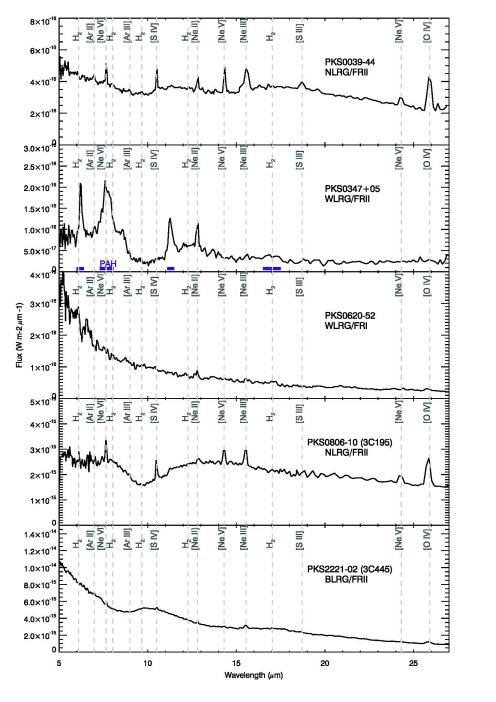 |
Figure 4. Example mid-IR spectra of radio AGN from the 2Jy sample, illustrating the diversity in the observed spectra. Various mid-IR fine-structure and PAH features are indicated. See Dicken et al. (2012), Dicken et al. (2014) for further details. |
In fact, it is remarkable that the degree of attenuation is apparently so similar for the [OIII] and 24µm emission in the radio AGN, given that the equivalent dust extinctions expressed in magnitudes in the V-band, are Av ∼ 1 magnitudes and Av ∼ 20 magnitudes for the [OIII] emission line and 24µm continuum respectively. Therefore, if the results are interpreted solely in terms of extinction, the [OIII] and 24µm emission must be extinguished by different dust structures, or by different parts of the same dust structure. For example, the 24µm continuum could be extinguished by the dust in the compact inner parts of the torus, and the [OIII] by larger-scale dust, perhaps in the outer parts of the torus, or a kpc-scale dust lane in the host galaxy. However, it is not possible to entirely rule out the possibility that, rather than being due to extinction, the difference between the 24µm luminosities of the NLRG and BLRG/Q objects at fixed [OIV] luminosity is due to contamination by beamed synchrotron emission from the radio cores, given that the degree of synchrotron contamination would be expected to be larger in the case of the BLRG/Q objects, because their jets are pointing closer to the line of sight.
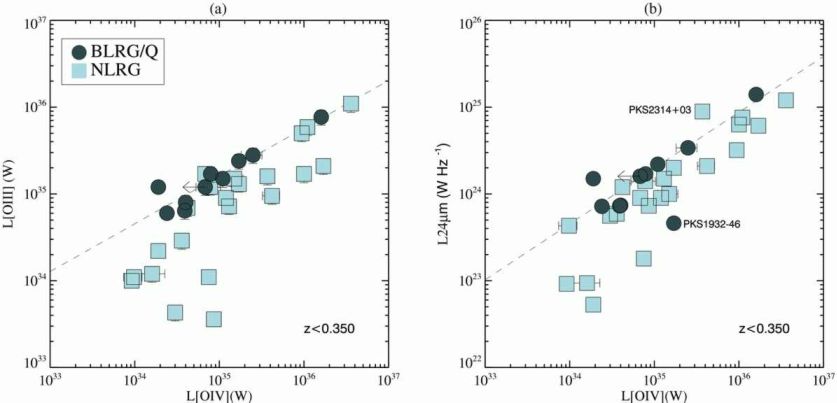 |
Figure 5. Correlation plots showing comparisons between different optical and mid-IR inidicators of intrinsic AGN power, highlighting the differences between NLRG and BLRG objects the combined 2Jy and 3CRR sample of (Dicken et al., 2014): (a) L[OIII] vs L[OIV], and (b) L24µ m vs L[OIV]. The dashed lines show the linear regression fits to the BLRG/Q points. Of the two objects highlighted in the right-hand plot, the NLRG PKS2314+03 is an object with prodigious starburst activity for which the 24µm emission is likely to be boosted by starburst heating of the near-nuclear dust, while it is suspected that the BLRG PKS1932-46 is under-luminous in 24µm emission because its AGN has recently entered a low activity state (Inskip et al., 2007). See Dicken et al. (2014) for further details. |
An alternative technique involves using the high spatial resolution of the HST to investigate the rate of detection of compact core sources at both optical and infrared wavelengths in samples of nearby radio sources. The bright AGN nuclei are expected to be heavily attenuated at optical wavelengths by dust in the torus for objects observed as NLRG. However, due to the decrease in dust extinction towards longer wavelengths, the torus will become more transparent in the near-IR, potentially allowing the direct detection of the compact nuclei. Early attempts to detect the compact near-IR nuclei in radio galaxies using ground-based observations produced some promising results for a few individual radio galaxies (Djorgovski et al., 1991, Simpson, Ward & Wilson, 1995), but were hampered by the difficulty of separating the AGN nuclei from the starlight, given the relatively modest spatial resolution. Therefore the HST, with its order of magnitude better spatial resolution, has revolutionised this area (see Baldi et al., 2010, Ramírez et al., 2014a). Figure 6 shows the detection rate of AGN nuclei in low redshift (z < 0.11) NLRG as a function of wavelength from the optical to the mid-IR 10. As expected, the rate of detection of AGN nuclei in the NLRG sources is low at optical wavelengths (< 30%), although interestingly not zero. The detection rate for the NLRG then rises with increasing wavelength through the near-IR to the mid-IR bands, reaching 80% at 2µm and 95% at 8µm (Ramírez et al., 2014a). This behaviour is entirely as expected on the basis of the standard orientation-based unified schemes. The infra-red fluxes and SED shapes deduced for the nuclei of NLRG are consistent with degrees of dust extinction in the range 10 < Av < 200 magnitudes (Tadhunter et al., 1999, Ramírez et al., 2014a).
 |
Figure 6. The detection of compact cores in NLRG/HEG and WLRG/LEG from the 3CR and 3CRR samples. Left: the grey-scale images show example 2.05µm images of 3CRR galaxies from (Ramírez et al., 2014a) for which models of the smooth underlying starlight have been subtracted to highlight the Airy rings surrounding the nuclear point sources. Right: the detection rate of nuclei as a function of wavelength in 3CR and 3CRR HEG and LEG galaxies at z < 0.11. Key for the points: black squares represent 3CRR WLRG/FRII sources from Ramírez et al. (2014a); black circles represent 3CR NLRG/FRII from Baldi et al. (2010) and Chiaberge, Capetti & Celotti (2002); open circles represent WLRG/FRII sources from Baldi et al. (2010) and Chiaberge, Capetti & Celotti (2002); and the open triangle represents WLRG/FRI sources from Chiaberge, Capetti & Celotti (1999). Note the increase in detection rate of compact cores with wavelength for the NLRG/FRII and WLRG/FRII sources, and the fact that WLRG/FRI sources show a much higher detection rate of compact cores at the shorter, optical wavelengths than the NLRG/FRII and WLRG/FRII sources. See Ramírez et al. (2014a) for details. |
At this stage it is important to add a caveat about the nature of the unresolved near-IR cores detected in NLRG. The near-IR light of type 1 AGN is dominated by the thermal emission of dust at close to the sublimation temperature in the inner parts of the obscuring torus, rather than accretion disk emission. Therefore it is possible that the unresolved nuclei detected in NLRG at near-IR wavelengths represent directly transmitted dust emission from the inner parts of the torus. However, alternative possibilities include non-thermal emission from the inner synchrotron jets and light scattered by dust in the near-nuclear regions (e.g. the far wall of the torus). Unfortunately, the recent detection of high degrees of linear polarisation in the unresolved near- and mid-IR nuclei of some NLRG (Tadhunter et al., 2000, Ramírez et al., 2009, Ramírez et al., 2014b, Lopez-Rodriguez et al., 2014) does not entirely resolve this issue, because the synchrotron, scattered AGN and transmitted AGN mechanisms could all produce significant IR polarisation (in the latter case via the dichroic extinction effect of aligned dust grains in the torus: Ramirez et al. 2009, 2014b). Note that if the near-IR emission of NLRG were dominated by synchrotron or scattered AGN emission, the level of extinction to the AGN would be higher than estimated based on the assumption that all the near-IR core emission is directly transmitted AGN light.
It is also possible to search for direct AGN continuum emission from NLRG at harder X-ray energies (> 2 keV), where the level of absorption by gas in the torus is reduced compared to that at EUV and soft-X-ray wavelengths. Again this is an area that has benefitted from improvements in technology in the last 20 years, with the launch of the Chandra and XMM satellites providing improved spatial resolution and sensitivity compared with previous X-ray satellites. One complication of the X-ray studies is that emission from the inner non-thermal jets — which are likely to suffer less attenuation than that of the AGN themselves — may contribute to the X-ray core fluxes. However, by explicitly accounting for the non-thermal component in the modelling of the X-ray spectra, it has proved possible to detect the attenuated X-ray emission from AGN in several NLRG: absorbed X-ray AGN components have been detected in 81% of the 21 NLRG 11 at z < 0.3 in the sample of 3CRR objects studied by Hardcastle et al. (2009), and in 84% of 19 NLRG in the 0.05 < z < 0.7 2Jy sample studied by Mingo et al. (2014). Thus the X-ray results are consistent with the near- to mid-IR results in the sense that they show the presence of heavily attenuated AGN is a high proportion of NLRG. However, for objects with both X-ray and near-IR HST observations, the attenuating HI columns are generally higher than predicted from the levels of near-IR dust extinction assuming the standard Galactic dust-to-gas-ratio (Ramírez et al., 2014a). This apparent inconsistency can be explained if AGN have a non-standard (order-of-magnitude higher) gas-to-dust ratio due to the AGN radiation field destroying dust grains in the inner part of the torus (Maiolino et al., 2001).
Despite the success of the X-ray and infrared imaging observations in detecting intrinsically luminous, obscured AGN in several NLRG, such observations do not allow the detailed spectra of the obscured AGN to be determined — an important step in demonstrating that the nuclei have quasar-like properties. Therefore, near-IR spectroscopy and optical spectropolarimetry observations — which have the potential to detect broad permitted lines characteristic of quasars in transmitted or scattered light — provide an important complement to the X-ray and infrared imaging observations.
Attempts have been made to detect the directly transmitted broad Paα emission using K-band spectroscopy of NLRG. However, despite claims of the detections in a few nearby NLRG (Hill et al., 1996), the observations have a low S/N, and this technique suffers from the fact that the infrared nuclei tend to be faint relative to the starlight of the cores of the host galaxies in most objects, and the broad Paα in typical type 1 AGN spectra has a low equivalent width compared with the optical Balmer lines (see discussion in Ramírez et al., 2009). Together, these factors make the detection of broad Paα in NLRG challenging, even with 8m-class telescopes.
Far more successful have been optical spectropolarimetry observations that use the alternative technique of detecting the broad Balmer lines in scattered light: there are now convincing detections of the scattered broad Hα lines in five NLRG in the local universe (Antonucci, 1984, Ogle et al., 1997, Cohen et al., 1999). Such observations provide the most direct evidence to support the orientation-based unified schemes for SLRG, because they demonstrate that individual NLRG have nuclei with the spectral characteristics of quasars.
Although scattered broad lines have so far been detected in a only handful of the dozens of NLRG in the 3CR and 2Jy samples at low redshifts (z < 0.2), the relatively low detection rate cannot be taken as strong evidence against the unified schemes. This is because several factors can confound the detection scattered broad lines, including the strong dilution of the polarised light by the starlight of the host galaxies, geometrical dilution of the polarization, a lack of scattering dust in the NLR, and illuminating AGN that are at the lower end of the intrinsic luminosity range for a given radio power. Moreover, many of the 3CR and 2Jy NLRG still lack deep spectropolarimetry observations. Unfortunately, it is unlikely that there will be rapid progress in this area in the near future, since making the requisite spectropolarimetry observations of a large sample of NLRG would be prohibitively expensive in observing time with the current generation of 8m telescopes.
Taken together, the statistical results from comparisons between the optical, mid-IR and radio properties of BLRG/Q and NLRG, the detection of highly attenuated AGN nuclei at X-ray, near-IR and mid-IR wavelengths in a high proportion of nearby NLRG, and the detection of polarised broad lines in scattered light in some NLRG, provide compelling evidence that the orientation-based unified schemes for SLRG work to first order: the data are consistent with the idea that all NLRG contain BLRG/Q nuclei that are obscured along our direct line of sight by circum-nuclear dust. The unification debate for SLRG now centres on the geometry of the central obscuring region (e.g. smooth torus, clumpy torus, warped disk), and also on whether the properties of the obscuring structures change with luminosity and redshift (e.g. Lawrence, 1991, Lawrence & Elvis, 2010, Elvis, 2012).
2.3. Orientation-based unification II: WLRG
While the orientation-based unified schemes are successful in explaining the relationship between NLRG and BLRG/Q objects amongst the SLRG, they cannot readily explain the relationship between WLRG and SLRG, or between FRI and FRII sources. Although it has been proposed that the WLRG objects might be SLRG radio galaxies in which the NLR is unusually heavily obscured by circumnuclear dust (e.g. Cao & Rawlings, 2004), the Spitzer results presented in Figure 7 demonstrate that this cannot be the case: a heavily obscured SLRG nucleus would be expected to radiate strongly in the mid-IR continuum and emission lines, whereas the WLRG have weak mid-IR continuum and [OIV] line emission (Hardcastle et al., 2009, Dicken et al., 2014); many of the WLRG are also weak at far-IR wavelengths (Dicken et al., 2009) 12, despite the fact that their continua are often dominated by non-thermal emission (Dicken et al., 2008, Leipski et al., 2009, van der Wolk et al., 2010). Similarly, the relationship between FRI and FRII sources cannot be explained in terms of orientation, because it is not possible to “hide” the strong radio lobe and hot spot emission typical of FRII sources in the FRI sources.
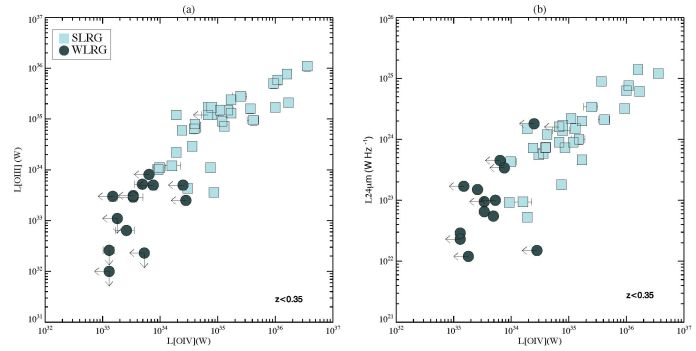 |
Figure 7.Correlation plots showing comparisons between different optical and mid-IR inidicators of intrinsic AGN power, highlighting the differences between NLRG and WLRG objects in the combined 2Jy and 3CRR sample of Dicken et al. (2014): (a) L[OIII] vs L[OIV], and (b) L24 µm vs L[OIV]. See Dicken et al. (2014) for further details of sample selection. |
Noting that FRI sources are almost invariably associated with WLRG optical spectra, and that BL Lac objects also show low equivalent emission lines, an alternative orientation-based unified scheme (see Figure 3(b)) has been proposed to explain the link between these two classes of objects (Urry, Padovani & Stickel, 1991, Urry & Padovani, 1995). In this case, the required anisotropy in the optical continuum is produced entirely through the beaming effect caused by the bulk relativistic motions of the inner jets; the presence or otherwise of a central obscuring torus in such objects is controversial. The beaming that is such a key part of this scheme explains why BL Lac objects — viewed with the line of sight close to the direction of the radio axis — have core-dominated radio morphologies and relatively flat radio spectra; beamed jet emission also explains the relatively strong, point-like, and highly polarised optical continuum sources that are observed at optical wavelengths in such objects.
Interestingly, HST observations also reveal point-like nuclei at optical wavelengths in a high proportion of WLRG/FRI sources (see Figure 6; Chiaberge, Capetti & Celotti, 1999, Verdoes Kleijn et al., 1999, Capetti et al., 2002). The strong correlations between the luminosities of the optical nuclei and those of the radio cores (Chiaberge, Capetti & Celotti, 1999), the optical to X-ray SED spectral indices (Balmaverde, Capetti & Grandi, 2006), and the detection of high degrees of optical polarization (Capetti et al., 2007) are all consistent with the idea that the optical nuclei in the WLRG/FRI objects represent synchrotron emission from the inner jets. At first sight the detection of the optical nuclei in FRI sources might seem to go against the orientation-based unified schemes, since the WLRG/FRI sources are considered to be the unbeamed counterparts of the BL Lac objects. However, even in the case that the radiation from the inner jets is strongly beamed, it is expected that some radiation will be detected from the jets in objects whose jets are pointing at a large angle to the line of sight. Moreover, the inner synchrotron jets could extend beyond any central obscuring tori that would otherwise block the emission of their nuclei at X-ray and optical wavelengths. Finally, as already noted, it is not clear whether the obscuring tori are present in the nuclei of typical WLRG/FRI objects.
The unification of BL Lac objects with FRI radio galaxies in the context of the orientation-based scheme shown in Figure 3(b) can be tested in a similar way to unified scheme for SLRG: by statistical comparison of properties that are considered to be isotropic. In this case the results are mixed: while the extended radio lobe luminosities of BL Lac objects and FRI radio galaxies appear to be similar (Urry & Padovani, 1995), on average the [OIII] emission line luminosities of the BL Lac objects are significantly higher when the comparison is made for low redshift samples (z ≤ 0.2: Urry & Padovani, 1995, Wills et al., 2004) 13. These results can be reconciled if there is sufficient circum-nuclear dust to significantly obscure the [OIII] emission in the WLRG/FRI objects. Certainly some WLRG/FRI objects do have kpc-scale dust lanes (de Koff et al., 2000). On the other hand, as we have already seen, most WLRG/FRI objects lack evidence for central obscuring tori.
A further relevant result is that broad permitted lines characteristic of type 1 AGN have been detected in some BL Lac objects — most notably Bl Lac itself (Corbett et al., 1996) and PKS0521-36 (Ulrich, 1981) — whereas, do date, there have been no convincing detections of broad permitted lines in any of the FRI objects in the 3CR and 2Jy samples 14. Even allowing for some obscuring dust in the circum-nuclear regions, by analogy with the SLRG unification scheme, we might expect a significant fraction of the WLRG/FRI objects — those observed at intermediate angles (the equivalent of the steep spectrum radio-loud quasars) — to show broad lines if these objects are truly the unbeamed counterparts of the BL Lac objects, and most BL Lac objects have a BLR in their nucleus. However, the result that FRI sources lack broad lines should be treated with some caution, because the broad lines might be difficult to detect against the strong stellar emission of the cores of the host elliptical galaxies, especially if the AGN luminosity (including the broad-line emission) scales with the extended radio luminosity (Rawlings & Saunders, 1991), such that the relatively low radio luminosity FRI sources have correspondingly low luminosity BLR emission.
Taking the results on FRI/BL Lac unification together, it seems unlikely that all BL Lac objects would appear as FRI sources if they were observed with their radio jets pointing at a large angle to the line of sight; however, it is entirely plausible that a subset of such objects (i.e. those with lower luminosity [OIII] emission) can be unified with FRI sources in this way.
This leaves the WLRG/FRII sources as true misfits in terms of the orientation-based unified schemes: they cannot be readily unified with WLRG/FRI sources because of the luminosities and morphologies of their extended radio emission, yet they cannot be unified with SLRG/FRII sources because of their low [OIII] emission line luminosities, lack of broad line emission, and low mid-IR continuum and emission line luminosities. Note that the latter mid-IR properties rule out the idea that the WLRG/FRII sources contain luminous AGN that are unusually heavily obscured, just as they do in the case of the WLRG/FRI sources.
Overall, it is clear that the orientation-based unified schemes are successful at explaining the relationship between NLRG and BLRG/Q objects in the case of SLRG, and less certainly between FRI radio galaxies and BL Lac objects in the case of WLRG. However, they cannot by themselves explain the full diversity of properties of the radio AGN population. In the following sections I discuss other factors that are important in determining the observed properties of radio AGN; many of these have come to light in the last 20 years.
2.4. Accretion rates and modes
Aside from anisotropy/orientation effects, it is natural to consider the possibility that the varied manifestations of the radio AGN phenomenon are related to the mechanisms that produce the AGN radiation and jets in the nuclear regions — the so-called “central engines” of the AGN — in particular, changes in rate or mode of accretion of material by the central supermassive black holes.
In this context, it is significant that there is a strong correlation between the radio morphological properties (e.g. Fanaroff & Riley types I and II) and the optical spectroscopic properties (e.g. WLRG/SLRG) of radio AGN (see Table 3). As we have seen, FRI radio sources are almost invariably associated with WLRG spectra, and SLRG are almost invariably associated with FRII or CSS/GPS radio sources; only the WLRG/FRII objects break the trend. This strongly suggests that radio morphological and optical spectroscopic properties are linked primarily through the natures of the central engines, rather than through external environmental factors. Note, however, that environmental factors may nonetheless affect the radio properties at some level. For example, entrainment of the relatively dense, hot ISM found at the centres of giant elliptical galaxies and clusters of galaxies may be required to explain the detailed properties of FRI jets (e.g. Laing & Bridle, 2014); and the confinement effect of a hot, dense ISM may act to boost the observed radio luminosity for a given intrinsic mechanical jet power (Barthel & Arnaud 1996, but see Ramos Almeida et al. 2013).
Further important clues are provided by examining the links between the levels of AGN activity, the host galaxy absolute magnitudes, and the radio morphological or optical spectroscopic classifications. Such links were first discussed in detail by Owen (1993) and Ledlow & Owen (1996) who plotted monochromatic radio power against host galaxy absolute magnitude and identified FRI and FRII sources with separate symbols (see Figure 8). Essentially, their plot demonstrates that the radio power that defines the break between FRI and FRII sources increases with increasing host galaxy luminosity: FRI sources hosted by luminous (and more massive) elliptical galaxies can have higher radio powers than those hosted by less luminous galaxies, without breaching the FRI/FRII radio power limit.
 |
Figure 8. A plot of 1.4GHz monochromatic luminosity against absolute R-Band magnitude for a sample of powerful radio sources in galaxy clusters, with FRI- and FRII-class objects marked with different symbols. Credits: this figure was originally published as Figure 1 in Ledlow & Owen (1996). |
A possible explanation for the trend shown in Figure 8 in terms of the accretion processes close to the supermassive black holes was suggested by Ghisellini & Celotti (2001) who noted that the radio power could be taken as a proxy for the overall level of AGN activity, while the host galaxy absolute magnitude is related to the mass of the central supermassive black hole (e.g. Kormendy & Ho, 2013). Therefore, Figure 8 could be recast as a plot of AGN power against the black hole mass, with the dividing line between FRI and FRII sources representing a fixed ratio of the AGN power to the Eddington luminosity of the black hole. This is the first suggestion that the division between FRI and FRII sources is due to an “Eddington switch”: a change in the nature of the accretion flow from a radiatively inefficient accretion flow (RIAF) that is geometrically thick but optically thin (FRI objects) to a standard geometrically thin but optically thick accretion disk (FRII objects) at a critical ratio of the jet power (Qjet) to the Eddington luminosity of the central black hole (Ledd). The critical ratio derived by Ghisellini & Celotti (2001) was in the range 10−3 < Qjet / Ledd < 10−2, although a more recent study by Wold, Lacy & Armus (2007) that used host galaxy velocity dispersion rather than absolute magnitude as a proxy for black hole mass found Qjet / Ledd ∼ 5 × 10⁻⁴.
Figure 8 can also be redrawn as a plot of emission line luminosity against host galaxy absolute magnitude, this time identifying objects by their optical spectroscopic classifications rather than their radio morphologies (Buttiglione et al., 2010). The results for the 3CR sample are shown in Figure 9. Just as there is a clear dividing line between FRI and FRII radio galaxies in Figure 8, there is a clear demarcation between HEG and LEG objects in Figure 9, with some evidence that the emission line luminosity that represents the boundary between the two classifications increases with host galaxy luminosity. Again, since the [OIII] luminosity is a good indicator of overall AGN power (e.g. Heckman et al., 2005), this trend can be interpreted in terms of an Eddington switch: LEGs are associated with radiatively inefficient accretion, and the HEG/BLOs with a standard thin accretion disk, with the transition between the two types occurring at Lion / Ledd ∼ 10−3, where Lion is the ionising luminosity of the AGN. This is also consistent with the recent results of both Best & Heckman (2012) for SDSS-selected radio AGN and Mingo et al. (2014) for the 2Jy and 3CR samples, who find a clear division between the Eddington ratios of low- and high-excitation objects at (Lbol + Qjet) / Ledd ∼ 10−2, where Lbol is the bolometric (radiative) luminosity of the AGN.
 |
Figure 9. [OIII] emission line luminosity plotted against the absolute H-band magnitude for 3CR sources in the sample of Buttiglione et al. (2010). The lines represent different fractions of the ionizing luminosity relative to the Eddington luminosity of the supermassive black hole. Credits: this figure was originally published as Figure 11 in Buttiglione et al. (2010). |
Interestingly, an Eddington ratio of ∼10−2 also represents the division between different accretion states in X-ray binary systems: from the low/hard to the high/soft states (Macarrone, 2003). Therefore, in terms of interpreting diagrams like Figs 8 and 9, analogies have often been drawn with X-ray binary systems (e.g. Falcke, Körding & Markoff, 2004, Körding, Jester & Fender, 2006), and it has been proposed that X-ray binaries and AGN together form part of a main sequence in black hole activity (Merloni, Heinz & di Matteo, 2003). A potential problem with this picture is that the high/soft state in X-ray binary systems is not commonly associated with the formation of non-thermal jets. However, Nipoti, Blundell & Binney (2005) have linked radio AGN with a transitory jet flaring stage of activity as sources pass between the low/hard and high/soft states (see also Körding, Jester & Fender, 2006), and radio-quiet AGN with the more usual non-flaring high/soft state. In this case, the transitory nature of jet flaring stage could be consistent with the fact that radio-loud quasars represent < 10% of the full quasar population: perhaps objects cycle through radio-loud and radio-quiet phases as part a particular quasar triggering event (but see Bessiere et al., 2012).
An important debate concerns whether the different radio AGN classifications, in particular the division between WLRG/LEG and SLRG/HEG, are related to the mode rather than the rate of accretion. On the basis that the powers of the jets of LEGs in the 3CR sample are consistent with fuelling via Bondi accretion of the hot ISM from the X-ray haloes of the objects, whereas HEGs are too powerful to be explained in this way, Hardcastle, Evans & Croston (2007) proposed that LEGs are associated with hot mode accretion, whereas HEGs are associated with cold mode accretion which has the capability to fuel the AGN at the requisite higher accretion rates; in this model the division between FRI and FRII sources is explained in terms of environmental effects. Buttiglione et al. (2010) also favoured the mode of accretion as being the dominant factor, arguing that any hot gas being accreted will not be able to cool to form a thin accretion disk and will therefore be associated with WLRG/LEG nuclear activity in radio AGN. On the other hand, cool gas in the process of being accreted will naturally form a standard accretion disk, leading to HEG-style nuclear activity.
Despite these arguments, it seems unlikely that all WLRG/LEG are fuelled by hot gas. Indeed, many have plentiful cold gas in their nuclear regions, as evidenced by nuclear dust lanes (de Koff et al., 2000), at least one shows evidence at mid-IR wavelengths for a compact, warm dust structure close to the nucleus (PKS0043-42: Ramos Almeida et al., 2011b), and the nuclear NLR of several WLRG/FRI sources — albeit of low luminosity compared to SLRG — appear compact and centred on nuclei in HST long-slit and imaging observations (Verdoes Kleijn et al., 1999, Capetti, Verdoes Keijn & Chiaberge, 2005), thus providing evidence that there is at least some warm gas on a sub-100 pc scale in these objects, even if the gas masses are relatively low. Therefore, it seems more plausible that accretion rate is the dominant factor, and that some WLRG are fuelled by cold mode accretion at a relatively low rate, even if the majority are fuelled by hot mode accretion (see also Best & Heckman, 2012).
Until recently, most studies of hot mode accretion assumed that the hot gas accretes as a spherical, unperturbed flow at the Bondi rate (Bondi, 1952). However, recent simulations that include realistic prescriptions for cooling, heating and turbulence, provide evidence that much of the hot gas in the nuclear regions on a scale of ∼0.1 — 1 kpc can condense into filaments of cool gas that fall near-radially towards the nucleus, with cloud-cloud collisions helping to dissipate any angular momentum in the gas (e.g. Gaspari, Peng & Oh, 2013, Gaspari, Brighenti & Temi, 2015). As a result, the accretion rates associated with such chaotic cold accretion (CCA) can be orders of magnitude higher than the Bondi rate — sufficient to trigger a quasar-like AGN. The CCA simulations — which clearly blur the distinction between hot and cold mode accretion — also predict the presence of large masses of cold gas and the formation of clumpy torus-like structures close to the AGN. Since these predictions are somewhat at odds with what we observe in the majority of WLRG/FRI objects, the applicability of CCA models to such objects is currently uncertain. Furthermore, if the CCA mechanism is as effective as the models suggest, we would expect luminous, quasar-like AGN to be common in rich clusters of galaxies, where the densities of hot ISM are relatively high; however, this appears inconsistent with the measured environments of most SLRG (see section 3.5).
On the basis of diagrams such as Figures 8 and Figure 9 it might seem plausible that the radio morphological and optical spectroscopic classifications of radio AGN are linked through the nature of the accretion onto the black holes via the Eddington switch i.e. FRI objects are always WLRG and are associated with low rates accretion and a radiatively inefficient accretion flow, whereas FRII objects are always SLRG and are associated with thin, radiatively efficient accretion disks. However, the WLRG/FRII sources do not fit into this picture. While the reason for this apparent discrepancy might be related to some aspect of the accretion flow onto the black hole that can generate powerful jets and an FRII radio morphology but not a SLRG nucleus, or perhaps to some particular combination of environmental and nuclear accretion factors, an alternative possibility is that it is due do the intermittency or even switching off the nuclear fuel supply. This possibility will be explored in the next subsection.
All types of broad-line AGN are known to vary by up to a factor of a few at optical wavelengths on timescales of weeks to years (Matthews & Sandage, 1963, Fitch et al., 1967). Radio AGN are no exception, and there are now detailed studies of bright, nearby BLRG that track the variability of both the broad lines and continuum, and use the time lags between the two types of emission to estimate the size of the broad-line region (e.g. Dietrich et al., 2012).
Apart from this “normal” AGN variability, which is likely to be due to relatively minor changes in the accretion flow that lead to a temporary increase or decrease in luminosity of the thermal accretion disk emission and hence the flux of ionising photons in the BLR, it is also possible that there are longer-time-scale variations in the fuelling of the AGN that lead to larger amplitude (i.e. factor of 3 or more) variations. There are two situations to consider here: high-amplitude intermittency in the fuel supply within a particular cycle of SLRG activity; and the switch-off phase at the end of a SLRG cycle, in which a longer-term scarcity of fuel causes the central AGN to shut down completely or enter a lower activity state associated with a low Eddington ratio.
Evidence for intermittency is provided by the radio structures of some radio sources. For example, the radio structure of the WLRG Hercules A (3C348: see Figure 10), shows hybrid FRI/FRII characteristics, including a series of bubble structures that may represent successive phases of high jet activity in the lifecycle of the source. Other objects show evidence for more than one phase of activity in the form of “double-double” radio structures (Schoenmakers et al., 2000), or high surface brightness, compact inner double structures combined with much larger-scale and lower-surface-brightness outer structures (e.g. PKS1345+12: Stanghellini et al., 2005).
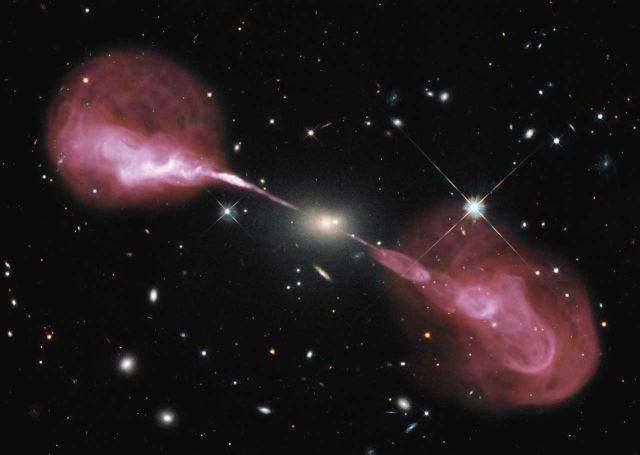 |
Figure 10. Radio image of the southern radio source Hercules A (pink) superimposed on an optical image of the same source. The radio image was made at frequencies between 4 and 9 GHz using a variety of VLA confirgurations, while the optical image represents a composite of images taken with the WFPC3 camera on the HST using the F606W and F614W filters. Credit: NASA, ESA, S. Baum and C. O'Dea (RIT), R. Perley and W. Cotton (NRAO/AUI/NSF), and the Hubble Heritage Team (STScI/AURA). |
The observational consequences of high-amplitude changes in the fuel supply depend on the timescales of the changes, and on the AGN components being considered. Observations show that the BLR, torus, NLR, and large-scale radio-emitting lobes of radio AGN have typical radial scales of rBLR ∼ 0.01 − 1 light year, rtorus ∼ 0.1 − 100 pc, rnlr ∼ 0.001 − 3 kpc 15, rlobe ∼ 0.05 − 1 Mpc, corresponding to light crossing times of τBLR ∼ 0.01 − 1 yr, τtorus ∼ 0.3 − 300 yr, τnlr ∼ 3 − 10,000 yr and τlobe ∼ 150,000 − 3 × 10⁶ yr respectively. Thus, when an AGN finally switches off due to the exhaustion of its fuel supply, this change will lead to a substantial decrease in the BLR and torus emission on a timescale of weeks to decades, in the NLR emission on a timescale of decades to thousands of years 16, and in the radio emission on a timescale of a hundred thousand to millions of years. It is notable that, due to their larger scales, the radio components access much longer time scales that the other components.
The different timescales of variability for the emission components on different scales in radio AGN could help to explain the apparent anomaly of the WLRG/FRII sources: perhaps these are objects in which the AGN has switched off or entered a low activity phase for a timescale of hundreds to thousands of years, such that there has been a substantial decrease in the nuclear NLR emission (hence the WLRG classification), but this information has yet to reach the hotspots in the radio lobes of the sources. This possibility has been discussed by Buttiglione et al. (2010) and Tadhunter et al. (2012); Capetti et al. (2011), Capetti et al. (2013) have also considered the possibility that WLRG with unusually low excitation emission line spectra — the so-called extreme low excitation radio galaxies (ELEG) — represent objects caught in the act of the NLR switching off. The advantage of associating the WLRG/FRII sources with the switch-off phase is that it explains their ambiguous status in the unified schemes. Moreover, in the context of explanations of both radio morphological and optical spectroscopic classifications in terms of an Eddington switch, it allows the link between FRII and SLRG, and between FRI and WLRG to be preserved, without the need to explain the WLRG/FRII sources in terms of special accretion flow physics.
It is also possible that the radio AGN classified as relaxed or fat doubles (Owen & Laing, 1989), which lack radio hotspots, but nonetheless have FRII-like radio lobes (e.g. 3C310, 3C314.1, 3C386 in the 3CR sample), represent a post-switch-off stage in the evolution of the radio sources, in which the hot spots have already responded to the decline in jet activity, but the relic lobes have not yet faded below the flux limoit of the sample. Significantly, ∼ 48% of all the 25 WLRG/FRII sources, but only ∼ 11% of all the 80 SLRG/FRII sources, in the 3CR and 2Jy samples of Dicken et al. (2009) and Buttiglione et al. (2009, 2011) could be classified as relaxed or fat doubles. It is also notable that spectral ageing studies of the lobes of at least two WLRG/FRII objects with relaxed radio lobes suggest that they represent relic radio sources in which the jets switched off ∼ 6 – 20 Myr ago (Mazzotta et al., 2004, Harwood, Hardcastle & Croston, 2015).
The switch-off phase must occur at the ends of the activity cycles of all powerful radio sources. However, it is also possible that the nuclear AGN/jet activity is intermittent, and switches off for timescales τnlr < toff < τlobe, within a full activity cycle. In this case, the fraction of FRII that are WLRG sets an upper limit on the proportion of time that the radio sources are “off” for timescales longer than τnlr within the cycle: foff ≤ 0.25 for the full 2Jy and 3CR samples 17, and foff ≤ 0.1 for the 29 sources at the higher radio power end of the 2Jy sample (P5 GHz > 1026 W Hz−1). These estimates are upper limits on the in-cycle intermittency because some WLRG/FRII sources may represent objects observed in the switch-off phase, and there may be other explanations for the WLRG/FRII phenomenon. We deduce from this that the fuel supply must be steady, and the AGN “on”, for the overwhelming majority of activity cycle. This is remarkable given that the rate of infall of gas to the nuclear regions may be clumpy rather than smooth, and the feedback effect of the jets and winds associated with the AGN may disrupt the fuel supply.
Note that, based on the existing spatially integrated spectra of radio galaxies, it is not possible to rule out the existence high-amplitude intermittency on shorter timescales (toff < τnlr). Indeed, Inskip et al. (2007) have argued that the 2Jy BLRG PKS1932-46 represents a case in which the AGN has recently entered a low activity phase, but this is not yet reflected in its NLR properties, because its [OIII] and mid-IR narrow emission line luminosities are much higher than expected from its relatively low X-ray, near-IR and mid-IR continuum luminosities, and Hα broad-emission-line luminosity. There are also several reports in the literature of “changing state” AGN in which broad lines near-disappeared, or appeared, on timescale of years to decades (e.g. Penston & Pérez, 1984, LaMassa et al., 2015, MacLeod et al., 2015, and references therein).
Before concluding that all WLRG/FRII sources represent powerful radio AGN in which the nuclear activity has switched off, either permanently of temporarily, it is important to consider some objections to this interpretation. First, it has been noted that the radio cores of WLRG/FRII sources are stronger than expected in the case that the nuclear activity has switched off (Buttiglione et al., 2010). Second, some WLRG/FRII appear to be in richer environments and have more luminous host galaxies than their SLRG/FRII counterparts, suggesting that the gaseous environments of the radio sources may play a role in determining whether a source appears as a WLRG/FRII (Hardcastle, Evans & Croston, 2007, Ramos Almeida et al., 2013, Ineson et al., 2015). However, neither of these objections is insurmountable. For example, in the case of the radio cores, at least some of the WLRG/FRII sources have radio cores that are significantly weaker relative to their extended radio emission than in SLRG/FRII sources; examples from the 2Jy sample include PKS0043-42, PKS0347+05, PKS1648+05 and PKS2211-17, all of which have core-to-extended radio flux ratios measured at 2.3 GHz of R2.3 GHz < 10−3 compared with a median of R2.3 GHz = 3 × 10⁻³ for the NLRG/FRII sources in the same sample (Morganti et al., 1997a). In addition, FRI radio galaxies have higher core/extended radio flux ratios on average than FRII sources (Morganti et al., 1997a), so if a SLRG/FRII source were to drop down to a lower level of nuclear activity consistent with it eventually becoming a WLRG/FRI source, this change would not necessarily have a dramatic effect on the radio core flux.
Considering the environments and host galaxies, it is notable that, even if WLRG/FRII sources are associated with richer environments and more luminous host galaxies on average than SLRG/FRII sources, there is a considerable range in, and overlap between, the environments and host galaxy properties of the two groups (Ramos Almeida et al., 2013, Ineson et al., 2015). It is also possible that the level of high amplitude intermittency depends on the environment and host galaxy properties (e.g. due to the nature of the fuel supply), such that FRII sources in rich environments and with massive host galaxies are more likely to be observed in a low activity (WLRG) phase. Alternatively, the confinement effect of the dense hot gaseous haloes in rich galaxy environments may lead to the relic radio sources remaining visible for longer than they would in lower density environments (see discussion in Murgia et al., 2011), thus making in more likely that WLRG/FRII sources will be observed in rich environments.
2.6. Relationship to lower luminosity radio AGN samples
So far, this review has concentrated on the results for samples of nearby radio sources selected in bright, flux-limited radio surveys such as the 3CR and the 2Jy. Because such surveys select relatively high luminosity radio sources, which are rare in the local universe, the sample sizes are modest. However, cross correlation of the SDSS optical and FIRST/NVSS radio catalogues has recently allowed the selection of much larger samples of nearby radio sources (z < 0.2) down to lower flux densities and radio luminosities (Best et al., 2005, Best & Heckman, 2012), albeit lacking the detailed radio and optical morphological, X-ray and infrared spectral information available for the brighter samples. It is interesting to consider how the sources selected in the bright radio samples compare with those in the SDSS-selected samples.
The homogeneous spectral data available for these SDSS-selected samples has allowed the radio luminosity functions to be derived separately for the LEG and HEG populations. The results are shown in Figure 11, which is taken from Best & Heckman (2012). While the HEG population starts to dominate the radio source population at the highest radio luminsoities, and the LEG population dominates at lower radio luminosities, it is interesting that both types of objects are present in the SDSS sample at all radio luminosities.
 |
Figure 11. The 1.4 GHz radio luminosity functions for LEGs (blue) and HEGs (red) derived from SDSS data by Best & Heckman (2012). See Best & Heckman (2012) for details. Credits: this figure was originally published as Figure 4 in Best & Heckman (2012). |
Although detailed radio morphological information is lacking for the SDSS-selected samples, based on the results for the 3CR and 2Jy samples, it seems highly likely that a large fraction of the LEG population at higher radio luminosities (L1.4 GHz > 1024 W Hz−1) are WLRG/FRI, with perhaps an admixture of WLRG/FRII sources, whereas the majority of the high radio power HEGs are SLRG/FRII sources. Moreover, the majority of these high radio luminosity sources are likely to be hosted by giant elliptical galaxies (see section 3.1 below). However, considerable uncertainty surrounds the natures of the HEG and LEG radio sources and their host galaxies at lower radio luminosities: for a given optical spectral classification, do the lower power radio sources have the same radio and optical morphologies as their higher radio power counterparts? Do the luminosity functions for the HEGs and LEGs each represent uniform populations of objects?
Concentrating first on the LEG objects, there is already evidence that the natures of the radio sources associated with the LEGs change dramatically with radio luminosity. For example, a recent radio morphological study of the low radio luminosity end of the LEG population (L1.4 GHz < 1024 W Hz−1) by Baldi et al. (2015) shows that most of the lower radio luminosity sources are compact and lack the prominent jets and diffuse lobes typical of more powerful LEG objects. Baldi et al. (2015) have labelled such sources FR0 radio galaxies, in recognition of the fact that they fall outside the usual FRI/FRII classification scheme (see also Ghisellini, 2011, Sadler et al., 2014). However, the host galaxies of most of the FR0 objects appear to be massive, early-type galaxies, just like their more powerful LEG counterparts.
The situation for the HEG sources is less clear. While the high radio luminosity end of the HEG population is dominated by FRII radio sources that are hosted by giant elliptical galaxies, the lower power end of the luminosity function of the HEGs overlaps with the high power end of the radio luminosity function of Seyfert galaxies (Meurs & Wilson, 1984), which are more likely to be hosted by spiral galaxies. This raises intriguing questions about the makeup of the HEG population: is there a gradual transition between spiral and elliptical host galaxies from low to high radio powers along the HEG sequence? How do the radio morphologies change along the HEG sequence?
2 See http://www.jb.man.ac.uk/atlas for a more detailed discussion of radio classifications schemes. Back.
3 Since the GPS and related CSS sources show strong morphological similarities with their more extended counterparts (O'Dea, 1998, Tzioumis et al., 2002), and are thought to represent radio sources in a young evolutionary phase (Fanti et al., 1995, Owsianik, Conway & Polatidis, 1998, Polatidis & Conway, 2003), in most of this review I will not distinguish them from the extended sources. However, note that the detection of GSP/CSS sources in flux-limited samples may be affected by selection effects related to the strong interactions between the compact radio sources and dense ISM in the central regions of the galaxies (Tadhunter et al., 2011, Morganti et al., 2011, Dicken et al., 2012). Back.
4 N.B. This object would also be classified as a BLRG on the basis of its broad Balmer emission lines. Back.
5 This includes the 3 objects classified by Capetti et al. (2011) as extreme low excitation radio galaxies (ELEGs). Back.
6 Buttiglione et al. (2010) and Capetti et al. (2013) also distinguish a class of radio AGN showing extremely low excitation emission line spectra that they label extreme low excitation galaxies (ELEGs). However, in what follows I make no distinction between LEGs and ELEGs and label them collectively as LEGs. Back.
7 Note that this sample extends to lower redshifts than the 0.05 < z < 0.7 2Jy sample of Dicken et al. (2009) described in Table 1. Back.
8 One object deserves particular mention here: 3C84 (also known as NGC1275). This object was originally classified as an FRI by Fanaroff & Riley (1974), but shows broad Balmer emission that lead to a BLRG optical classification. Also, as expected for a BLRG, it has luminous narrow lines, albeit of low ionization (hence the LEG classification of 3C84 by Buttilgione et al. 2010). On the basis of these properties, 3C84 could be considered as the only FRI object in the combined 3CR and 2Jy sample classified as a SLRG. However, its radio structure is highly peculiar, with a strong, highly variable flat spectrum core, an inner steep spectrum double structure, and an outer halo (Pedlar et al., 1990). Therefore, its radio morphological classification must be regarded as uncertain; it is certainly not a typical FRI source. Back.
9 Note that Haas et al. (2005) derive a larger attenuation factor of ∼ 7 based on a smaller, more heterogeneous sample Back.
10 Note that the mid-IR AGN detection rates are based on photometric measurements with the IRAC instrument on the Spitzer satellite. In this case, rather than using high spatial resolution to detect the compact nuclei, the AGN are detected as an excess in the mid-IR continuum over the flux in the starlight predicted on the basis of an extrapolation of the near-IR starlight flux, with the latter measured from HST observations using the same aperture as used for the Spitzer/IRAC measurements (see Ramírez et al., 2014a). Back.
11 Using updated optical spectral classifications from the data in Buttiglione et al. (2009, 2010) and other sources. Back.
12 The exceptions are WLRG that have a strong starburst heated dust component or substantial contamination of their far-IR emission by non-thermal jet emission. Back.
13 This is consistent with the idea that the relatively low equivalent widths of the optical emission lines in BL Lac objects is due to their strongly beamed optical continuum emission, rather than their low emission line luminosities. Back.
14 Discounting the 3C84, which, as noted above, has a peculiar radio morphology. Back.
15 This is the typical scale on which the narrow-line emitting gas accessed by the nuclear apertures used for the spectroscopic classification is emitted. Many radio galaxies show lower-surface-brightness extended emission line nebulosities on much larger scales (up to ∼ 100 kpc: Baum et al., 1988, Tadhunter, Fosbury & Quinn, 1989a), but these are not used for the optical spectral classifications of the sources. Back.
16 Note that, for a typical cloud in the NLR, the time taken for the [OIII] emission to fade following a substantial decline in the ionizing flux is negligible compared with the light crossing time of the NLR (Capetti et al., 2013). Back.
17 Note that WLRG with hybrid FRII/FRI radio morphologies were counted as WLRG/FRII sources when making this estimate. Back.