


Most data on nearby stellar GWs in the first 20 years of earnest work came from the optical and X-ray bands. These studies fell largely into two classes: (1) long-slit spectroscopic and/or narrowband imaging surveys (e.g., [21, 22, 23]) or (2) case studies using optical 3D spectroscopy, X-ray imaging spectroscopy, or narrowband imaging (e.g., [24, 25, 26, 27]). This work was primarily focused on starburst galaxies, which lie above the star-forming main sequence in SFR. High-mass starbursts are typically luminous in the infrared (IR) and classified as either luminous or ultraluminous infrared galaxies. These LIRGs and ULIRGs are defined to have LIR > 1011 L⊙ and LIR > 1012 L⊙, which corresponds to SFR > 10 M⊙ yr−1 and SFR > 100 M⊙ yr−1 if all the IR luminosity is powered by star formation. Low-mass (dwarf) starbursts are luminous in the UV and optical bands.
New observing capabilities, surveys, and archival databases have allowed probes of more physical conditions, broadening the picture of winds sketched first by small studies of the warm and hot ionized and cool neutral phases. They have also extended the study of winds to main-sequence galaxies.
This section is divided into four parts. First, I discuss new UV surveys of nearby starbursts. Second, I visit the use of the Sloan Digital Sky Survey (SDSS) for outflow studies. Third, I summarize results from the widening use of integral field spectroscopy. I end by surveying significant advances in revealing and quantifying the molecular gas and dust in GWs using ground-based submillimeter and space-based FIR telescopes.
The rest-frame UV contains many interstellar absorption lines and Lyα, the brightest UV emission line in unobscured starbursts. Previous UV instruments have been used to study individual systems or small samples, but the sensitivity of COS has enabled population studies of low-z, UV-bright starbursts at high signal-to-noise (S/N). These studies are large enough to study correlations between the properties of GWs and galaxy properties.
Two studies find a correlation between the velocity of the ionized outflow and basic properties of the galaxy and starburst itself: stellar mass M* and star formation rate SFR [28, 29]. Table 1 compares these correlations and the ionization states probed. The first [28] uses COS data on 48 starbursts at z < 0.26 taken from the literature. The second [29] combines COS and Far-Ultraviolet Spectroscopic Explorer (FUSE) data on 39 starbursts at z < 0.25 [30] plus MMT or Keck spectra of 9 compact starbursts at z = 0.4−0.7 [31, 32]. Notably, the studies differ in their definition of outflow velocity. The first [28] uses the 50% and 90% points in the cumulative velocity distribution (CVD; starting from the red side of the line). The second [29] uses either the 98% point of the CVD (in the case of data taken from secondary sources [31, 32]) or the authors’ own velocity measurements (vmax). I label the correlations from this second study with vmax for simplicity.
| Axes | Tracer | IP (eV) | N | Range | Slope | p | Reference |
| v50 % vs. SFR | Si II | 16.3 | 48 | 10−1 − 102 M⊙ yr−1 | 0.22 ± 0.04 | <0.001 | [28] |
| v50 % vs. SFR | Na I | 5.1 | 41 | 10−1 − 103 M⊙ yr−1 | 0.35 ± 0.06 | ⋯ | [33] |
| v50 % vs. SFR | Na I | 5.1 | 13 | 100.8 − 102.2 M⊙ yr−1 | 0.15 ± 0.06 c | ⋯ | [34] |
| v50 % vs. SFR | Na I | 5.1 | 13 | 100.8 − 102.2 M⊙ yr−1 | 0.30 ± 0.05 c | ⋯ | [34] |
| v90 % vs. SFR | Si II | 16.3 | 48 | 10−1 − 102 M⊙ yr−1 | 0.08 ± 0.02 | 0.002 | [28] |
| v90 % vs. SFR | Na I | 5.1 | 59 | 10−1 − 103 M⊙ yr−1 | 0.21 ± 0.04 | <0.001 | [23] |
| v90 % vs. SFR | H I, N II | 13.6–29.6 | 48 | 100.7 − 102.6 M⊙ yr−1 | 0.24 ± 0.05 | <0.001 | [35] |
| vmax vs. SFR | Si II, C II, Mg II | 15.0–24.4 | 48 | 10−2 − 103 M⊙ yr−1 | 0.32 ± 0.02 | <0.0001 | [29] |
| v50 % vs. M* | Si II | 16.3 | 48 | 109 − 1011.5 M⊙ | 0.20 ± 0.05 | 0.002 | [28] |
| v90 % vs. M* | Si II | 16.3 | 48 | 109 − 1011.5 M⊙ | 0.12 ± 0.03 | 0.003 | [28] |
| v90 % vs. M* b | Na I | 5.1 | 52 | ⋯ | 0.28 ± 0.08 | <0.001 | [23] |
| v50 % vs. vcirc a | Si II | 16.3 | 48 | 101.8 − 102.5 km s−1 | 0.87 ± 0.17 | 0.002 | [28] |
| v90 % vs. vcirc | Na I | 5.1 | 20 | 101.4 − 102.7 km s−1 | 0.85 ± 0.15 | <0.001 | [23] |
| v90 % vs. vcirc a | Si II | 16.3 | 48 | 101.8 − 102.5 km s−1 | 0.44 ± 0.09 | 0.003 | [28] |
| vmax vs. vcirc a | Si II, C II, Mg II | 15.0–24.4 | 48 | 101.3 − 102.5 km s−1 | 1.16 ± 0.37 | <0.0001 | [29] |
| η vs. M* | O I, Si II–Si IV | 13.6–45.1 | 7 | 107 − 1011 M⊙ | −0.43 ± 0.07 | <0.001 | [36] |
| η vs. M* | H I, N II | 13.6–29.6 | 33 | 109.6 − 1011.2 M⊙ | −0.43 | ⋯ | [35] |
| η vs. M* b | Na I | 5.1 | 42 | 1010 − 1011 M⊙ | −0.95 ± 0.20 | 0.006 | [23] |
| η vs. vcirc a | O I, Si II–Si IV | 13.6–45.1 | 7 | ⋯ | −1.56 ± 0.25 | <0.001 | [36] |
| IP gives the ionization potential range of the atomic tracers; N is the number of galaxies in the fit; the range applies to the galaxy property in the fit; the slope is for a linear fit in log-log space (or the exponent of a power law fit in linear space); and the p-value is the estimated likelihood of a null correlation. For references where only the correlation coefficient is provided, the p-value is inferred from it. a vcirc is calculated from M⋆ using a linear scaling. [28, 36] use log(vcirc / km s−1) = 0.28 log(M⋆ / M⊙) − 0.67 from [37], while [29] uses log(vcirc / km s−1) = 0.29 log(M⋆ / M⊙) − 0.79. b M⋆ is assumed to be proportional to the K-band luminosity. c The first of these fits uses integrated spectra; the second is from spatially resolved fits. | |||||||
While both studies find correlations, the ranges of galaxy properties in one are wider [29]. This study also finds steeper slopes in lines fitted to the data; the slopes from the two studies differ at > 1σ. The second study does not specify a fitting method [29], while the first uses a method that accounts for x and y errors, outliers, and scatter [28]. Neither study finds a significant correlation between outflow velocity and specific star formation rate sSFR ≡ SFR / M*. One also finds no correlation with star formation rate surface density ΣSFR, but their sample has a range ΣSFR = 10−2 − 101 M⊙ yr−1 kpc−2 [28]. The second study adds three orders of magnitude to the upper end of this range and do find a correlation, which they parameterize as vmax = 3296 / [ (ΣSFR / 1307.9)−0.34 + (ΣSFR / 1307.9)0.15 ] at a significance of p < 0.0001 [29].
The mass outflow rate  and mass outflow rate normalized to the
star formation rate (η ≡
/ SFR)
1
were computed for subsamples of these two larger samples
[30,
36].
One study estimates the wind column density using multiple ions and a
stacked spectrum; they apply this single column density to the entire
sample of 39 galaxies
[30].
Their mass outflow rate is then a product of the outflow velocity and
starburst radius times a constant. They find a correlation between
and SFR that is
near-linear (though the slope is unquantified) and which appears to be
driven largely by the correlation between
and
vmax. They also find that η is inversely correlated
with SFR and M* (or vcirc).
and mass outflow rate normalized to the
star formation rate (η ≡
/ SFR)
1
were computed for subsamples of these two larger samples
[30,
36].
One study estimates the wind column density using multiple ions and a
stacked spectrum; they apply this single column density to the entire
sample of 39 galaxies
[30].
Their mass outflow rate is then a product of the outflow velocity and
starburst radius times a constant. They find a correlation between
and SFR that is
near-linear (though the slope is unquantified) and which appears to be
driven largely by the correlation between
and
vmax. They also find that η is inversely correlated
with SFR and M* (or vcirc).
The other study finds a similar result for the inverse correlation of η and galaxy mass ([36]; Figure 1; Table 1). While based on a much smaller sample size, this work uses high signal-to-noise spectra, velocity-resolved optical depths and covering factors, and photoionization modeling to estimate the ionization state, density, metallicity, and inner radius of the wind (assuming a model relating velocity and radius). The measured slope (−0.43 ± 0.07) matches predictions from numerical simulations, which are in the range −0.35 to −0.50 at low masses [38, 39, 41, 42].
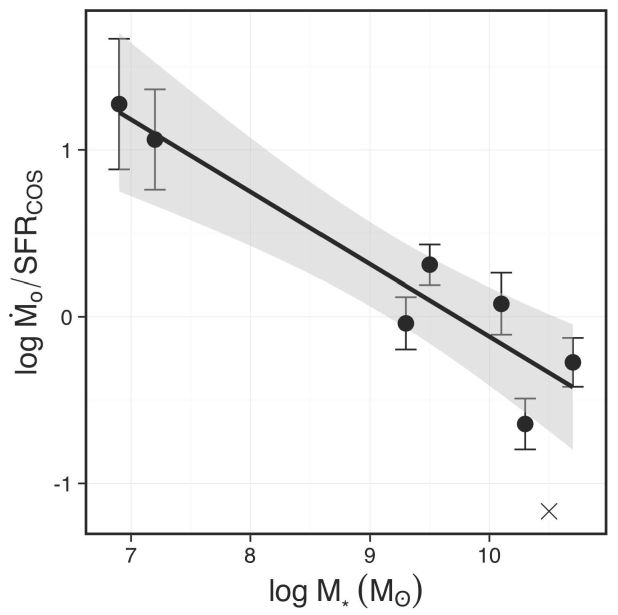 |
Figure 1. A fit to η ≡
|
The velocity measurements in these UV surveys employ lines from ions of relatively low ionization potential [28, 29], while the estimated wind masses are inferred from a larger range of ions [30, 36]. The resulting fits to GW vs. galaxy properties are in overall agreement with similar fits made a decade earlier using the cool, neutral gas phase (Table 1; [23, 33]). The spread in fitted slopes illustrates the systematic uncertainties in this enterprise, but a conservative synthesis points to velocity depending on SFR and M* as v ∼ SFR0.1−0.3 and v ∼ M*0.1−0.3. The dependence on circular velocity is thus steeper (close to linear). The upper end of the range of slopes of v vs. SFR matches a prediction from simulated absorption lines in 3D hydrodynamic simulations [40]. There are fewer measurements of how η depends on various properties, and the systematic uncertainties in η are higher than in velocity. However, as discussed above, published fits are surprisingly consistent with predictions from numerical simulations [41, 42], including at high masses where the slope steepens [23, 42].
This begs the question of what drives the scatter in these relationships. It is worth noting that the pursuit of scaling relations relies on reducing the velocity field of a galactic outflow to a single parameter in a single tracer. Outflows are unlike galaxies in that they are inherently a violent, non-equilibrium process whose structural properties are governed by time-varying power sources, gas hydrodynamics, and radiation transfer rather than gravitational processes. Their properties thus almost certainly depend on multiple host parameters simultaneously. The fact that outflow properties scale at all with bulk galaxy properties such as SFR is not surprising (more energy means higher-velocity gas). There are clearly important details beyond this, however, that are harder to quantify and may reflect the unique structural properties or history of particular galaxies (Is it a merger? Did the outflow just turn on?) or other hidden scalings that are orthogonal to those with SFR and mass. One solution might be to combine multiple galaxy or wind properties into single parameters in search of an “outflow fundamental plane,” but combining, e.g., two parameters into one has yet to noticeably improve matters [29, 36].
The imprint of GWs in the UV is found not only absorption lines but also in Ly emission lines and the escape of ionizing radiation beyond the Lyman limit. Extended Lyα emission and Lyman continuum (LyC) escape may be caused in part by outflows that create low-density holes in a galaxy's ISM.
Recent studies of Lyα and absorption lines in samples of order tens of galaxies have quantified the impact of outflows on the properties of Lyα and the escape of LyC. Population studies of Lyα in nearby galaxies are, however, more complicated to interpret than studies of absorption lines because of the resonant emission and absorption behavior of Lyα and its sensitivity to dust. As a result, these studies have not reached firm conclusions on how these tracers reflect GW properties. There is some suggestion that outflow velocity is correlated with Lyα escape fraction [43, 44, 45, 46, 47, 48, 49]. However, this correlation has significant scatter, and cases exist of low outflow velocity and high LyC escape [49]. Lyα and outflow velocity are also both correlated with SFR and/or ΣSFR [47, 48]. In one sample, galaxies with and without escaping LyC have similar outflow velocities [48]. The simple presence of outflows may be a necessary but not a sufficient condition for Lyα and/or LyC escape [45]; other factors such as the outflow acceleration, low H 1 column density, or low metallicity may also be required for Lyα or LyC to exit the dense regions of a galaxy [44, 46, 48].
Searches for outflows in single-aperture optical spectroscopic surveys like SDSS are hampered by the spatially unresolved bright host galaxy. Outflow features in emission lines are typically overwhelmed by ionized gas emission from the star-forming host disk, which in galaxies with modest GWs lies in the same velocity range as the outflow. Interstellar absorption lines can be similarly dominated by stellar absorption features.
Both limitations can be overcome with data of high enough S/N and high-quality modeling of the underlying stellar continuum. Stacking of many spectra is commonly used to achieve the required S/N, and stellar models that match the spectral resolution of SDSS are mature. (Even if these models may not uniquely constrain the star formation history or stellar population properties, they fit the data very well.)
Three studies of GWs in star-forming galaxies have stacked SDSS DR7 data. The authors of the first of these stack 105 high-mass (M* ∼ 1010 − 1011 M⊙) galaxies in bins of various physical parameters to study the properties of cool, neutral outflows using the interstellar Na 1 D doublet [50]. They detect this resonant line in both absorption and emission. They find that the velocity and equivalent width of absorption scale with inclination, such that face-on galaxies are observed to have faster, higher equivalent width outflows, consistent with the model of minor-axis outflows. Outflow equivalent width and linewidth also correlate with ΣSFR (over the range 10−2.5 − 10−0.5 M⊙ yr−1 kpc−2) and M* (over the small range 1010.3 − 1011.2 M⊙). However, systemic interstellar absorption also scales with ΣSFR and M*, so the nature of these correlations is uncertain.
The second study uses 200,000 galaxies to stack by SFR and M* over a range of galaxy properties comparable to the ranges in samples of individual galaxies ([51]; Table 1; Sections 2.1 and 2.3): SFR = 10−2.7 − 102.3 M⊙ yr−1 and M* = 107.3 − 1011.8 M⊙. They fit [O III] 5007 Å, Hα, and [N II] 6548, 6583 Å using a high S/N instrumental profile and extract the line-of-sight velocity distribution (LOSVD) of both the ionized gas and stars. They use excess blueshifted emission-line gas at the extreme end of the gas LOSVD to measure outflow velocity, with the stellar LOSVD serving as a reference. For star-forming galaxies selected by line ratio [52], these authors find that vout correlates significantly with SFR and sSFR. vout does not correlate with M*, though it does with stellar velocity dispersion, suggesting a discrepancy in how these quantities are measured. This method is most sensitive to higher-velocity outflows, and outflows are detected primarily at SFR > 1 M⊙ yr−1 and sSFR > 10−9 yr−1. They are also preferentially observed in galaxies with SFR values that put them above the main sequence.
Finally, a third study employs a similar technique over a larger sample of 600,000 galaxies in bins of SFR and M* [53]. These authors apply two methods for parameterizing outflows: (1) they fit the [O III] emission line in each stack using two Gaussians; and (2) they use the observed [O III] profile as the gas LOSVD and calculate measures of line width and asymmetry. They then remove the instrumental resolution in quadrature. They find no significant detection of starburst-driven winds in star-forming galaxies. However, they select star-forming galaxies using a more restrictive line-ratio criterion [54] than the ionized gas study that does detect stellar GWs [51]. They argue that a more permissive selection [52] allows low-luminosity AGN to contaminate a sample of star-forming galaxies; these AGN could in turn produce outflows in galaxies that are supposedly purely star-forming. Low-luminosity AGN exist throughout the star-forming sequence with a range of contributions to [O III] [15, 16]. It is certainly plausible that star formation, rather than low-luminosity AGN, powers the outflows detected in galaxies whose line emission is dominated by star formation [51], but separating potential contributions from low-luminosity AGN requires further work.
These stacking studies add weight to the conclusions drawn from studies of smaller samples and individual galaxies by probing more statistically complete samples of galaxies across a wider range of basic galaxy properties. There is agreement between two of the stacking studies discussed above that ionized and/or neutral winds are a common feature of galaxies of modest to high SFR across the mass spectrum [50, 51], consistent with results discussed elsewhere in this review. The disagreement with the third study [53] on this point is puzzling, though the difficulty of separating AGN from star formation as a possible energy source in galaxies with supermassive black holes accreting at lower Eddington ratios is a valid concern. Furthermore, the correlations between wind and galaxy properties are akin to those seen using UV and other optical studies (Section 2.1; Table 1), and the connection to inclination angle is consistent with a wide range of observational results.
Though they cannot yet match the numbers of galaxies observed in the SDSS, spatially resolved spectroscopic surveys with optical IFSs promise to significantly improve the detectability and characterization of GWs. This is true both at ground-based resolution and with enhanced spatial resolution from adaptive optics; the latter is important for probing the nuclear regions of galaxies where GWs emerge from their power sources. Studies of one or a few galaxies with stellar GWs published in the current decade are numerous [55, 56, 57, 58, 59, 60, 61, 62, 63, 64]. These detailed case studies highlight the ubiquity and complex, multiphase nature (ionized, neutral, dusty) of these winds (Figure 2) and the power of IFS for leveraging the combination of spectral and spatial information to separate outflows from their hosts.
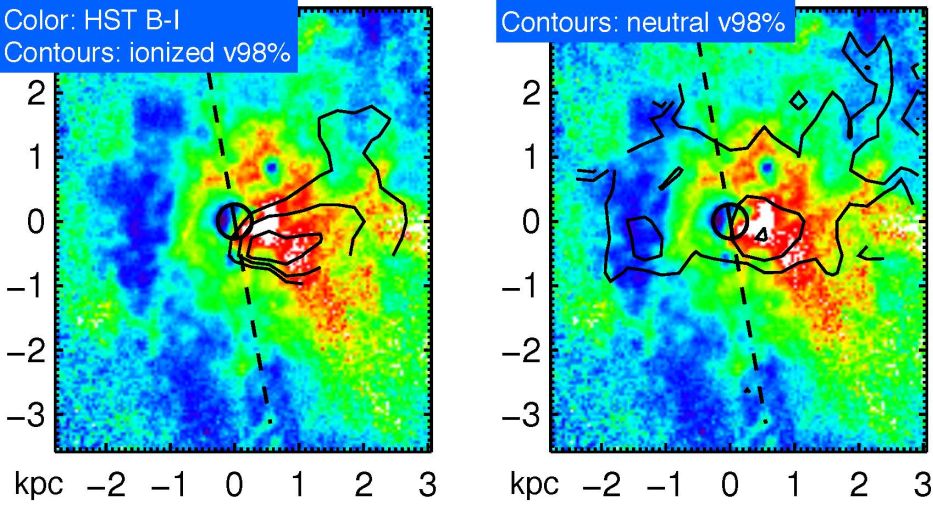 |
Figure 2. Illustration of the complex, multiphase structure of a nearby starburst-driven GW as observed with IFS (F10565+2448; [57]). The background color maps are HST images of F435W − F814W (or B − I), where red and white indicate the reddest colors. They show dusty filaments emerging from the obscured starburst along the minor axis in red and white; the near side of the star-forming disk is shown as the blue clumpy regions to the left in each panel. The galaxy major axis is the dashed line, and the contours show ionized gas v98% on the left (−800, −700, −600 km s−1) and cool, neutral v98% on the right (−700, −600, −500 km s−1). The minor-axis outflow reveals dusty filaments and unresolved gas motions of hundreds of km s−1, consistent with a shocked outflow with layered clumps of gas. The axes are in kpc. Reproduced by permission of the AAS from Figure 17 of reference [57]. |
Small surveys using instruments that target one galaxy at a time have characterized GWs in galaxies with the highest star formation rates. The authors of a study of the ionized gas in 27 LIRGs [65, 66] found frequent shock ionization accompanied by high gas velocity dispersions, a conclusion supported by an earlier long-slit study of ULIRGs [67]. The line ratios are consistent with models of slow shocks, correlate with σgas, and may be caused in part by GWs [65, 66].
The authors of a larger study of the ionized and cool, neutral gas in ∼ 50 LIRGs and ULIRGs [34, 35] concur that high ionized gas linewidths are shock-powered. To detect GWs, they spatially integrated their spectra [34, 35] and/or fit the spatially resolved data [34]. In the former case, they corrected the velocity of each spatial position for gravitational motions and then summed over the field of view. Fits to the wind velocity vs. SFR give best-fit slopes of 0.24 ± 0.05 (ionized gas), 0.15 ± 0.06 (integrated neutral gas), and 0.30 ± 0.05 (spatially resolved neutral gas). These are consistent with the single-aperture fits discussed above (Section 2.1; Table 1). η is between 0.1 and 1 in the neutral and ionized gas, with average values similar to those previously estimated in LIRGs and ULIRGs [23, 57]. The study of integrated spectra [35] finds evidence that η decreases with increasing dynamical mass over the range 109.6 − 1011.2 M⊙, with a log-log slope of −0.43 that is identical to that found in the UV over a much wider mass range ([36]; Section 2.1; Table 1). (A steeper slope in this relationship at high masses, as previously measured [23], is predicted by some simulations [39, 42].) Finally, these authors fit a relationship between η and ΣSFR with a log-log slope of 0.17 [35].
Two major (of order thousands of galaxies) IFS surveys have been ongoing for several years: the SAMI (Sydney-Australian-Astronomical-Observatory Multi-object Integral-Field Spectrograph) Galaxy Survey [68] and MaNGa (Mapping Nearby Galaxies at Apache Point Observatory) [69]. These surveys employ instruments that target multiple galaxies at once, each with a single, small IFS. Though limited in spatial resolution (of order 2′′), the ability of these surveys to integrate to high S/N, collect large samples of galaxies across a wide parameter range, and separate the outflow from the host galaxy using both spatial and spectral information with IFS promises more accurate statements about the ubiquity and property of stellar GWs over a wider range of galaxy types.
The first result from these surveys relies on a sample of 40 edge-on SAMI disk galaxies [70]. These authors use minor-axis kinematic asymmetries to detect winds and find them down to very low ΣSFR (10−3 M⊙ yr−1 kpc−2). The asymmetry increases with ΣSFR and is associated with recent bursts of star formation. The connection of the asymmetry to GWs and its association with high ΣSFR and high-temperature extraplanar gas is bolstered by comparison to simulations [71].
The most rapid progress in the study of stellar GWs has come from molecular gas and dust continuum measurements. The direct dust measurements have been made in the MIR/FIR using space-based telescopes: AKARI, the Spitzer Space Telescope, and the Herschel Space Observatory. The molecular gas measurements have been led by ground-based interferometers such as the Atacama Large Millimeter/submillimeter Array (ALMA), SubMillimeter Array (SMA), Institut de Radioastronomie Millimétrique (IRAM) Plateau de Bure interferometer (PdBI), and Nobeyama Millimeter Array (NMA), though Herschel has also played an important role. While sample sizes are still small and most studies have focused on individual galaxies in the starburst regime, results point to the ubiquity of dusty molecular gas entrained in stellar GWs.
Recent interferometric measurements of CO transitions have uncovered outflowing cold molecular gas in approximately 11 nearby LIRGs and ULIRGs whose energy output is dominated by star formation [72, 73, 74, 75, 76, 77, 78, 79]. Molecular outflows in four very nearby star-forming galaxies with lower SFR have also been studied in detail: NGC 3628, M82, NGC 253 (Figure 3), and NGC 1808 [80, 81, 82, 83]. M82 had been the only previous starburst galaxy known to host a molecular outflow [84, 85].
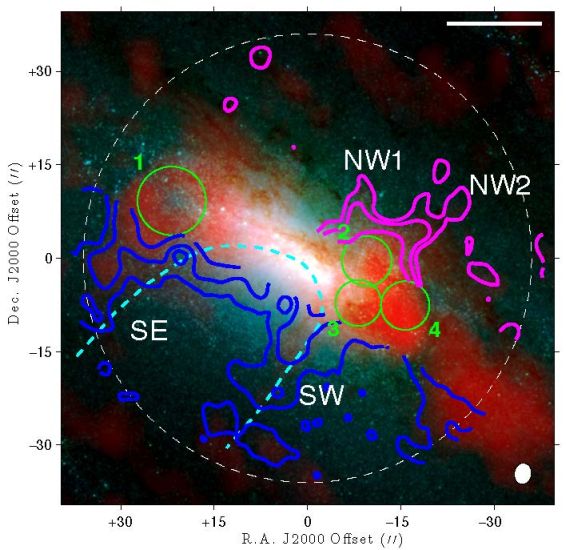 |
Figure 3. One of the nearest and best-resolved molecular gas outflows in NGC 253 [81]. The background image is HST NIR (blue+green) and ALMA CO (red). The blue (magenta) contours show the approaching (receding) CO outflow. The green circles outline expanding molecular shells. The white bar is 250 pc long. The dashed cyan contour outlines the warm/hot ionized outflow that is interior to the molecular gas streamers and extends to larger scales (Section 2.4; [86]). NGC 253 is one of only a few examples of the characteristic minor-axis filaments of a GW in molecular gas and their relationship to the disk and other gas phases. Reprinted by permission from reference [81], ©2013. |
These molecular outflows are typically confined to the inner kpc of
the galaxy (in radius). They have modest outflow velocities in nearby
disks (tens to a few hundred km s−1) but have a
broader range of peak velocities in the more luminous starbursting disks
and mergers (300–800 km s−1). Similarly, the
outflow rates appear to scale with SFR and/or ΣSFR. The
nearby, low-luminosity starbursts have
values of a few to a
few tens of M⊙ yr−1, while the LIRGs
and ULIRGs have a broader range of estimated
: several to several
hundred M⊙ yr−1 (perhaps even
∼1000 M⊙ yr−1 in
F17208−0014;
[75]).
Mass outflow rates of these magnitudes
are similar to the star formation rates in these systems, and equal to
or larger than the mass outflow rates estimated in other gas
phases. The larger mass outflow rates in the molecular phase are due
primarily to larger total outflowing gas masses.
Dense gas, as probed by characteristic molecules such as HCN and HCO+, is also a common feature of these outflows. It is present in the extended outflows of M82, NGC 253, NGC 1808, and Arp 220, as observed in emission using interferometry [78, 87, 88, 89, 90]. Outflowing dense molecular gas has also been observed in absorption in the inner regions of the highly obscured binary Arp 220 [91, 92, 93, 94].
The ubiquity of starburst-driven molecular outflows was first discovered using FIR OH and H2O absorption lines with Herschel [95, 96, 97, 98, 99]. The outflow properties inferred from these spatially unresolved absorption lines and detailed radiation transfer models are comparable to measurements from molecular emission-line interferometry [99]: massive, high-velocity but compact flows.
The cold molecular and cool atomic gas share similar dynamics. Global OH properties correlate with those measured from the 158 µm [C 2] emission line [100], which traces photo-dissociation regions (PDRs). The 158 µm [C 2] line may be a key technique for tracing outflows at high z as it moves into the submillimeter band. OH properties may also correlate with Na 1 D atomic gas measurements [23, 33, 57, 98, 99, 100, 101], though there is significant scatter in this correlation. On the spatially resolved level, FIR atomic fine structure lines are seen in the GWs of M82 [102], NGC 2146 [103], and NGC 253 [104]. In M82 and NGC 253 these atomic PDR tracers correlate well with the molecular gas in terms of morphology and dynamics [102, 104].
Direct observations of atomic H 1 in outflows may become possible with the next generation of sensitive radio arrays. New Jansky Very Large Array H 1 data on M82 are consistent with a deceleration of the outflow as it moves upward into the halo [105], suggestive of a galactic fountain [82].
Warm molecular gas does not contribute significantly to the mass budget of outflows, but the strength of its emission lines in the accessible NIR band makes it a useful tracer of the extent and physical state of molecular gas. Deep near-infrared (NIR) imaging and spectroscopy shows that shocked, warm H2 in the M82 outflow extends several kpc from the disk along the minor axis [106, 107]. Outflowing warm molecular gas has been detected in several nearby, starburst-dominated ULIRGs using the 2.12 µm H2 1-0 S(1) transition [60, 108/a>, 109]. These outflows are compact (< 2 kpc), with velocities of a few hundred km s−1, and the relationship between the cold and warm phases requires further study. Indirect evidence from the global properties of a large sample of ULIRGs implicates shocks in GWs as the origin of excess warm H2 in this population [110].
Dust and molecular gas are abundant under similar physical conditions. Observations of filamentary dust structures along disk minor axes in some wind systems and the correlation of these dust features with outflowing atomic gas columns are indirect evidence for outflowing dust in stellar GWs (Figure 2; e.g., [50, 57, 111]). Further evidence in the form of UV reflection nebula and polarized line emission strongly suggests the presence of dusty winds in M82 and NGC 253 [112, 113, 114]. Modeling of UV reflection in the M82 wind indicates smaller average grain sizes in the M82 wind compared to the disk [114, 115].
Observations of thermal emission from dust in galaxies where the disk and outflow can be spatially separated strengthen the case that stellar GWs are dusty in at least some cases. Studies detect 1−4 × 10⁶ M⊙ of dust in M82 (traced at 7–500 µm) extending far from the disk plane [116, 117], as well as significant amounts of cold dust emplaced by tidal interaction with M81 [118].
Roughly 106 M⊙ of warmer dust (traced at 70–160 µm) is also found in the outflows of NGC 253 and NGC 4136 [119, 120] in structures that correlate with ionized gas emission at other wavelengths. The extended cold dust in NGC 4631, however, may be of tidal origin [120], as in the case of M82. In the dwarf galaxy NGC 1569, 70–500 µm imaging indicates a large reservoir (a few times 105 M⊙) of circumgalactic dust, perhaps deposited by its starburst-driven GW [121]. At shorter wavelengths, GW features in NGC 1569 are seen in warm dust emission [122]. Contrary to these results, no dust is detected at 37µm in the NGC 2146 wind [103]. FIR observations of dwarf galaxies with outflows observed at other wavelengths paint a nuanced picture of dusty outflows in systems with lower SFR [121]; few systems show abundant circumgalactic dust or strong correlations with multiwavelength signatures of GWs.
Finally, polycyclic aromatic hydrocarbons (PAHs) are prominent features of GWs in those galaxies in which they have been detected. As alternately large molecules or small dust grains, PAHs bridge the gap between molecular gas and dust and are luminous features in rest-frame 3–20 µm spectra. An enormous PAH nebula extends from the M82 disk [123] and shows evidence for grain shattering from PAH line ratios [107, 124]. PAHs have been found in GWs in other galaxies [125, 126], and the amount of extraplanar PAH emission in galaxies may correlate with ΣSFR [126].
The warm and hot ionized gas traced by UV absorption lines, optical emission lines, and X-rays are prevalent in GWs (Sections 2.1 – 2.3). Quantifying the physical relationship between the molecular and ionized gas phases thus appears to be within reach. In a few nearby systems this connection has been made, but there has been no attempt for most galaxies (probably because the ability to detect the molecular phase of the outflow is still relatively new). There is a need for sensitive, multiphase studies at the highest spatial and spectral resolution to connect these outflow components.
M82 and NGC 253 both have deep, high-spatial-resolution maps of warm ionized gas (Hα), hot ionized gas (soft and hard X-rays), and molecular gas. These two exemplars paint a picture of an innermost hot, ionized wind fluid [27] that entrains warm and hot ionized material which are spatially correlated with each other and surround the hot fluid, perhaps as a shell [86, 127]. The cold molecular gas in turn envelops these ionized phases as it is entrained from the disk (Figure 3; [81, 82]). The relationship between the warm molecular and ionized phases, however, is likely more complex. In examples of minor-axis outflows where both are spatially resolved, there is coarse-grained spatial correlation (Arp 220 [78, 128], F08572+3915 [57, 129], and M82 [106]), but in other cases there is not (NGC 4945; [130]). At very high spatial resolution, apparent correlation may break down [106]. Note that the outflows in some of these galaxies may be AGN-driven, but they are included here because the sample size of galaxies with resolved molecular and ionized outflows is unfortunately small.
1 This quantity has an uncertain physical interpretation, though at face value it might quantify the capability of a wind to act as negative feedback on star formation. The logic is: if η > 1, then more gas is leaving the region than is forming stars. Thus, the outflow is going to deplete gas more quickly than star formation (maybe leading to fewer stars in the end). It is sometimes referred to as the mass-loading efficiency or factor, perhaps suggesting that it measures the amount of gas that is “loaded” into the wind as it moves through the galaxy. That is, it is the ratio of the mass of gas that eventually emerges from star-forming regions to the mass of outflowing gas that is initially produced by star formation through, e.g., stellar winds and supernovae. However, it is not a direct measure of this. The term mass-loading originated with studies of how much cool, ambient gas is mixed into a hot wind phase in the model of a wind driven by a hot fluid. Back.