


In this review I do not discuss mechanisms for producing the observed level of ionization in the BAL region nor do I discuss the details of mechanisms proposed for accelerating the BAL region clouds to the high outflow velocities that are observed. These topics are covered in some detail in the review by Weymann, Turnshek and Christiansen (1985). They review the substantial problems involved with reconciling the observed BAL region column densities with the results of photoionization models which adopt solar abundances. These problems are still not solved, probably because BAL region abundances are very enhanced relative to solar abundances (see Section 3.6). They also review acceleration mechanisms and show that a thermal wind model provides a very effective way of accelerating the BAL region clouds given the constraints that observations impose on models. Despite evidence for absorption-absorption line-locking, the force due to radiation pressure is likely to play only a minor perturbing role in the cloud acceleration process.
My main goal in this section is to present a geometric and kinematic picture of the BAL region which follows from the observations. This is a necessary first step for developing an accurate complete model of the BAL region which eventually can explain the origin of the BAL and emission line regions, the ionization, the abundances, the acceleration and the details of the observed velocity structure. To accomplish this, first I discuss the starting point for developing such a model for the BAL region. Next, I discuss constraints which place both upper and lower limits on the size-scale of the BAL region and discuss evidence which indicates that the global BAL region covering factor is small. Observational considerations which place constraints on the large and small scale geometry of the BAL region and which provide evidence that the BAL region flow is decelerating in PHL5200-type BAL QSOs are then presented. While the geometric and kinematic model that is developed for the BAL region is consistent with the observations, a considerable amount of observational and theoretical work needs to be done in the areas of evaluating selection effects in discovery programs and model calculations in order to explore the details. I also review evidence suggesting that BAL region abundances are enhanced relative to solar values. After presenting this geometric and kinematic model, I then discuss how this view may fit into the framework of models for the QSO's broad and narrow emission line regions.
3.1. The Starting Point of a Model
There are a number of issues which need to be weighed when trying to arrive at a starting point for a model of the BAL region. One issue involves assessing the success of previous models which may provide the basis for building a model of the BAL region. Given that existing models which postulate the existence of many small clouds are fairly successful within the range of parameter space that they have explored, a basic question is: can the constraints provided by observations of BAL QSOs be incorporated into existing models without altering the existing models too much? In the case of the BAL region the answer is a qualified `yes'. One finds that the existing models can be built upon, but only at the expense of reinforcing the multi-component picture of the QSO emission line region which has been reviewed and motivated in some detail by Davidson and Netzer (1979) and more recently by Osterbrock and Mathews (1986). On the other hand, an equally valid approach is to take a fresh look at the problem and decide whether new information provided by the observations of BAL QSOs suggests a completely different starting point for a model. For example: do the data warrant treating BAL QSOs as a separate population of QSOs which are largely unrelated to more normal non-BAL QSOs? Do the data provide some constraint which would completely invalidate a basic assumption of existing models or which is at odds with constraints imposed by non-BAL QSO observations? Since the answer to these last two questions is `no', the approach that has been taken here is to try to fit the BAL region into the framework of existing models. This is done, while at some level realizing that this is not an ideal situation, because it is always apparent that constraints on model parameter space are not very extensive.
Notably, some other workers have taken the opposite approach (e.g., Surdej and Swings 1981; Drew and Gidding 1982; Drew and Boksenberg 1984; Surdej and Hutsemekers 1987). Generally, these authors present models for the BAL regions of QSOs that are not consistent with the framework of existing models and they adopt the view that BAL QSOs and non-BAL QSOs represent two essentially different populations of QSOs. It is fairly clear that, within the context of the model which will be developed here, this cannot be true. As discussed in Section 3.3, within the framework of existing models, observations constrain the maximum value of the global BAL region covering factor to be fairly small, implying that certain lines-of-sight to QSOs with BAL regions must show fairly normal non-BAL QSO spectra. It remains to be seen whether additional constraints which are derived from observations of BAL and non-BAL QSOs become incompatible, thereby demanding two separate populations of objects. In the interest of not trying to invent new populations of objects without cause, it would seem that the present course of trying to fit the BAL region into the framework of existing models is the most profitable one.
3.2. The Size Scale of the BAL Region
Based on imaging studies of low redshift BAL QSOs (see Section 2.8), it is fairly clear that the BAL region does not arise many kiloparsecs from the central source QSO as a result of the acceleration of the host galaxy's interstellar medium due to the presence of an active nucleus. This possibility was originally proposed by Scott, Christiansen and Weymann (1984) and presumably would require the QSO's host galaxy to be viewed edge-on for BALs to be seen. This is definitely not the case for the BAL QSO Q1411+442. On the contrary, the more recent possibility that BAL profile properties are correlated with corresponding broad emission line profile properties suggests that the BAL region is intimately related to the broad emission line region which is thought to be on the order of ~ 1 pc from the central source. In addition, the observation of BALs from excited states of FeII and possibly FeIII with lower level excitations in the 0.12-3.7 eV range reported by Hazard et al. (1987a, b) would also suggest that the BAL region is nearby the central source.
In the context of existing models, observations which place both a lower
limit and
an upper limit on the BAL region location with respect to the central
source have been discussed
(Turnshek et
al. 1985;
Turnshek and Grillmair
1986;
Turnshek et al.
1988).
Good agreement with the observed data in the region of the
Ly- / NV profiles
can be obtained if one assumes that the BAL region is separate and
distinct from and completely occults the region producing the
Ly- broad emission line. Therefore,
as a direct lower limit on BAL region location, one knows that it lies
farther from the central source than the region producing the
Ly- broad emission line. This is
consistent with the conclusion that MgII broad emission lines cannot be
produced in the BAL region
(Turnshek et
al. 1984).
This lower limit is therefore dependent on
the model for the broad emission line region (see
Section 3.7). At the same time, constraints
imposed by the photoionization process can be used to infer a lower
limit on ner2.
(the BAL region electron density times the distance to the BAL region squared).
This is because the photoionization parameter is
/ NV profiles
can be obtained if one assumes that the BAL region is separate and
distinct from and completely occults the region producing the
Ly- broad emission line. Therefore,
as a direct lower limit on BAL region location, one knows that it lies
farther from the central source than the region producing the
Ly- broad emission line. This is
consistent with the conclusion that MgII broad emission lines cannot be
produced in the BAL region
(Turnshek et
al. 1984).
This lower limit is therefore dependent on
the model for the broad emission line region (see
Section 3.7). At the same time, constraints
imposed by the photoionization process can be used to infer a lower
limit on ner2.
(the BAL region electron density times the distance to the BAL region squared).
This is because the photoionization parameter is
 =
L
=
L /
ne r2 and the luminosity,
Lv, is known. Thus, there is a minimum value for
ne r2 because photoionization will
make the BAL region level of ionization too high if
ner2 is too low. The minimum
amount of emission arising from collisional excitation in the BAL region
can thus
be estimated given suitable values for the global BAL region covering
factor, the
temperature of the BAL region, the column density of the ion of
interest, and so on
(Turnshek 1984a).
The results generally indicate that observable high ionization
broad emission lines may arise due to collisional excitation in the BAL
region, even
for very small assumed values of the global BAL region covering factor. This is
especially true for
[OIII]
/
ne r2 and the luminosity,
Lv, is known. Thus, there is a minimum value for
ne r2 because photoionization will
make the BAL region level of ionization too high if
ner2 is too low. The minimum
amount of emission arising from collisional excitation in the BAL region
can thus
be estimated given suitable values for the global BAL region covering
factor, the
temperature of the BAL region, the column density of the ion of
interest, and so on
(Turnshek 1984a).
The results generally indicate that observable high ionization
broad emission lines may arise due to collisional excitation in the BAL
region, even
for very small assumed values of the global BAL region covering factor. This is
especially true for
[OIII] 5007 broad emission. In
fact, the lack of observed broad
[OIII] emission in low redshift QSOs has been used to constrain the
global BAL region
covering factor to be less than 0.01 for the case where
ne < 106 cm-3 in the BAL
region. Since the fraction of QSOs observed to have BALs is greater than
0.01, this
latter result generally leads to the conclusion that
ne > 106 cm-3 in the BAL region,
which suggests for upper limits that the BAL region lies within ~ 500 pc
for the most
luminous QSOs and within ~ 30 pc for the least luminous QSOs. However,
due to the
uncertainties regarding abundances and the level of ionization of the
BAL region (see Section 3.1 and
Section 3.6), it is very important at this stage to
remember that these deductions
are not based on self-consistent calculations; the emissivity of the
BAL clouds due to collisional excitation is not very tightly constrained.
5007 broad emission. In
fact, the lack of observed broad
[OIII] emission in low redshift QSOs has been used to constrain the
global BAL region
covering factor to be less than 0.01 for the case where
ne < 106 cm-3 in the BAL
region. Since the fraction of QSOs observed to have BALs is greater than
0.01, this
latter result generally leads to the conclusion that
ne > 106 cm-3 in the BAL region,
which suggests for upper limits that the BAL region lies within ~ 500 pc
for the most
luminous QSOs and within ~ 30 pc for the least luminous QSOs. However,
due to the
uncertainties regarding abundances and the level of ionization of the
BAL region (see Section 3.1 and
Section 3.6), it is very important at this stage to
remember that these deductions
are not based on self-consistent calculations; the emissivity of the
BAL clouds due to collisional excitation is not very tightly constrained.
3.3. The Global BAL Region Covering Factor
The global BAL region covering factor for a QSO is simply the fraction of the
QSO covered by BAL region clouds integrated over all possible
lines-of-sight to the QSO. As discussed by
Turnshek (1984a),
an upper limit on the size of the global
BAL region covering factor can be set by assuming that no more than the entire
observed NV broad emission line may be created by NV resonance line
scattering of
inner continuum plus Ly-
photons in the BAL region. Using a constraint based on
NV instead of CIV has advantages. For the case of CIV, an upper limit on
the global
BAL region covering factor is usually set either by checking the
residual intensity at
the bottom of the CIV absorption trough or by checking for excess
extended emission
on the red side of the CIV broad emission line. However, these upper limits on
the global covering factor must apply only for the case where the BAL
region flow
is accelerating. As I note in Section 3.5, this may
not be the case for some BAL QSOs.
Furthermore, in cases where CIV is utilized, one usually assumes that
most of the
observed CIV broad emission line does not come from resonance
line scattering, but
rather arises from collisional excitation. This is consistent with
models for the broad
emission line region and the fact that collisional excitation must
contribute to the
CIV broad emission line because a CIII] broad emission line is
observed. Of course,
the CIII] broad emission line cannot come from resonance line scattering
since CIII]
BALs are not observed. However, since models for the broad emission line
region often
predict little NV emission due to collisional excitation, it is not
ad hoc to assume that
most of the observed NV emission comes from resonance line scattering.
In order to set a limit on the global covering factor, one must first
assume that the
NV absorption troughs are extensive enough in wavelength coverage to
scatter most
inner Ly- broad emission line
region photons. This is seen to be true in most BAL
QSOs by an examination of the spectra. Examples of where this does or does not
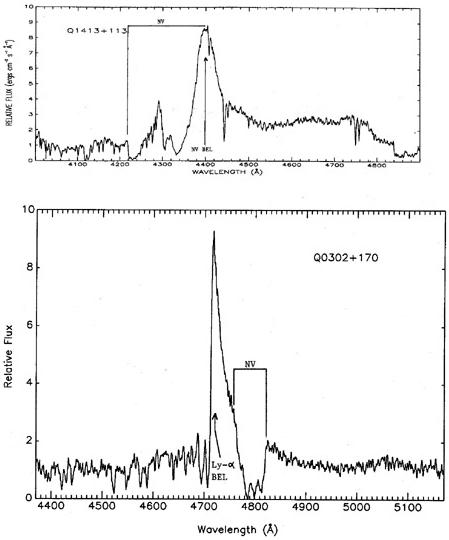
occur are shown in Figure 6. As a result of the
fairly low BAL region outflow velocities
in the BAL QSO Q0302+170, Figure 6 shows that
the NV broad emission line is not
very enhanced by resonance line scattering; however, in the more normal
case where
BAL region outflow velocities are large, the NV broad emission line
appears enhanced as in the spectrum of Q1413+113 also shown in
Figure 6.
|
Figure 6. Spectra of the
Ly- |
In order to place limits on the maximum value of the global BAL region covering factor, it is convenient to initially assume that the equivalent width of the scattered NV emission produced will be independent of observer aspect angle. As I discuss in Section 3.4 and note below, the assumption of spherical symmetry is probably erroneous, but the assumption gives a firm upper limit on the value of the global BAL region covering factor. Finally, one must also assume that none of the NV scattered radiation is destroyed. From these considerations, observations of BAL QSOs allow us to infer that the global BAL region covering factor is less than 0.2-0.4 for most BAL QSOs, regardless of whether the flow is accelerating or decelerating. Of course, the covering factor is probably lower than this because some of the NV broad emission line may arise from collisional excitation and because the global BAL region geometry and BAL cloud shapes may be such that NV photons are preferentially scattered in the direction of the observer in BAL QSOs (see Section 3.4). If the BAL region flow is accelerating, the depth of troughs and the strength of any red emission extension for CIV would generally require global BAL region covering factors less than 0.1-0.2 (Turnshek et al. 1980; Junkkarinen 1983). These estimates of the maximum value of the global BAL region covering factor are typical for most BAL QSOs. The exceptions are cases where the NV and/or CIV broad emission lines are much weaker. In these cases the upper limits on the value of the global BAL region covering factor can be considerably lower.
Surdej and Hutsemekers (1987) have recently argued that the results of this type of analysis may be in error and that, as noted in Section 3.1, the simplest interpretation of the BAL QSO phenomenon is that BAL QSOs and non-BAL QSOs form at least two distinct populations of QSOs. This would imply that the global BAL region covering factor was near unity, suggesting that one's line-of-sight would nearly always intercept a BAL region when observing a QSO that had BAL regions, regardless of the observer's aspect angle. Surdej and Hutsemekers suggest that three mechanisms may reduce the net amount of emission created by resonance line scattering, thus invalidating the results discussed above. First, they note that turbulence in an expanding atmosphere can reduce the emission to absorption ratio in a resonance line scattering model. Second, they note that occultation by the central core is particularly important for decelerating flows and can reduce the net emission from resonance line scattering. Third, they claim that collisional de-excitation in the BAL region can destroy the resonance line scattered photons. They further argue that separate populations of BAL and non-BAL QSOs are consistent with the data because the (underlying) broad emission line properties of the two classes of objects differ. While it is true that the broad emission line properties of BAL QSOs and non-BAL QSOs probably differ, aspect angle effects in non-spherically symmetric geometries and small global BAL region covering factors may also explain these differences since they are not large. This is not surprising because such a model has extra free parameters. The main point which should be made here is that a large global BAL region covering factor, which Surdej and Hutsemekers (1987) favor, is apparently inconsistent within the frame work of existing models because the mechanisms they propose for reducing the emission from resonance line scattering probably will not operate (Turnshek et al. 1988). However, the validity of any criticisms should be considered in the context of choosing an appropriate starting point for a model (Section 3.1).
Finally, one remaining argument, implicit from the discussion in the previous section, suggests that the BAL region has a small global covering factor. Namely, if the global BAL region covering factor were not small, one would expect substantial emission due to collisional excitation (e.g., from CIV) arising in the BAL region.
Turnshek (1984a) has suggested that even for BAL region covering factors as low as 0.03 the amount of emission produced by collisional excitation in the BAL region may be substantial.
3.4. The Large and Small Scale Geometry of the BAL Region
The discussion so far has concentrated on understanding the location and
lateral
extent of the BAL region clouds relative to the region emitting the
broad Ly- line,
how this relates to broad line emission that may arise in the broad
absorption line
region and how the observations constrain the value of the global BAL
region covering
factor. It seems clear that, due to the location of the BAL region and
the normally
extensive outflow velocities that are observed, resonance line
scattering in the BAL
region leads to efficient production of NV broad emission lines in QSO
spectra. Taking
this to be true, one can consider the question of what properties the
large and small
scale BAL region geometry would have to be in order to explain the observations
that:
In order to explain only the first observation, one must assume that the BAL region has some symmetry about the central source. Therefore, on the large scale the BAL region is unlikely to have a single jet-like geometry, and is more likely to have either a spherically symmetric geometry, a disk-like geometry or a geometry in which oppositely opposed BAL region jets exist. In order to explain the second observation, a mechanism must exist to have the NV resonance line scattered photons preferentially scatter in the direction of the BAL region clouds. The model must be such that an observer would see stronger NV broad emission lines when his line-of-sight passed through the BAL region (i.e., in a BAL QSO) as opposed to when his line-of-sight did not intersect a BAL region (i.e., in a non-BAL QSO). A geometry in which NV photons are scattered in such a preferential direction cannot be a spherically symmetric one. However, NV photons can be made to scatter in a preferential direction (i.e., in the direction of BAL region clouds) both in a disk-like geometry and in a geometry with oppositely opposed jets, providing some small scale geometric constraints are imposed on the shapes of individual BAL region clouds. A geometry in which the BAL region is confined to a disk-like plane around the central source QSO is considered here. In order to have photons preferentially scatter along the plane of the disk, the small scale BAL region geometry would have to be such that individual BAL clouds were pancake-shaped with the thinnest part of the cloud being in the direction of the BAL region outflow. With this small scale geometry, photons would preferentially escape perpendicular to the pancake surface. Figure 7 schematically illustrates the large and small scale BAL region geometry postulated. An additional reason why the large scale BAL region geometry is likely to be non-spherically symmetric rather than spherically symmetric has been given by Turnshek (1986), where it is argued that the multiplicity of troughs seen in many BAL QSOs indicates that, although the global BAL region covering factor is small, the local BAL region covering factor is fairly large. This suggests that a non-spherically symmetric geometry, possibly a disk-like one, holds. Based on observations of low redshift BAL QSOs (e.g., Malkan, Green and Hutchings 1987), the orientation of such a BAL region disk is unlikely to be aligned with the disk of any host galaxy.

|
Figure 7. Postulated large and small scale geometry for the BAL region. Photons find it hard to escape perpendicular to the plane of the large scale BAL region disk (upper figure) because individual clouds are pancake shaped (lower figure). |
If NV broad emission lines are typically enhanced by a factor of ~ 2 when the line-of-sight passes through the BAL region disk, then the global BAL region covering factor, as deduced from NV, more likely must lie in the 0.1-0.2 range, rather than the 0.2-0.4 range noted earlier. Such an enhancement is consistent with the observations given our knowledge of the selection effects in the samples that have been used to infer that NV broad emission lines are enhanced in BAL QSOs.
3.5. Is the BAL Region Flow Accelerating or Decelerating?
Recently, Turnshek et al. (1988) made a detailed study of PHL5200-type BAL QSOs. These QSOs show rather narrow (e.g., CIV FWHM ~ 2500 km s-1) broad emission lines with line-to-continuum ratios of ~ 2 and smooth absorption starting at outflow velocities close to zero (e.g., see Figure 2). Their analysis of one BAL QSO in particular, Q1413+113, shows that the regions giving rise to all of the broad emission lines in that spectrum are likely to be completely covered and occulted by the BAL region. This leads to a problem for models of the BAL region which have the region accelerating on the large scale. The problem is that accelerating models for the BAL region would produce a NV broad emission line that appears not to be occulted by the BAL region. One way around this apparent contradiction is to prefer a model for Q1413+113 in which the BAL region outflow velocity decreases with increasing distance from the central source, i.e., a decelerating flow. Several investigators have shown that in a decelerating region, apparent occultation of emission will occur even for the case where emission arises in the decelerating flow (Grachev and Grinn 1975; Marti and Noerdlinger 1977; Surdej and Swings 1981). Although at the present time deceleration can only be inferred from evidence for occultation, it is important that future work actually try to fit the data using a resonance line scattering model with a decelerating flow. As will be discussed in the next section, this evidence for deceleration is not at odds with some of the results that have been obtained from narrow and broad emission line region studies.
3.6. Abundances and Ionization in the BAL Region
In a poster for this Workshop, Grillmair and Turnshek (1987) present an algorithm for determining BAL region column densities as a function of outflow velocity. This technique has been used to determine column densities for a number of BAL QSOs, and in particular for two BAL QSOs which lend themselves to interesting abundance determinations in a second poster by Turnshek et al. (1987). I summarize the results on abundance determinations presented in these posters. In the BAL QSO Q0932+501 the C/H abundance ratio is inferred to be enhanced 10-100 times solar values. In the BAL QSO Q1413+113 the Fe/C or P/C and S/C abundance ratios are inferred to be enhanced at least a factor of 100 over solar values. Data on BAL QSOs as a class suggest that the abundance of metals is generally enhanced relative to solar values.
3.7. Relation Between the BAL Region and the Emission Line Regions
First I should point out that, irrespective of the correctness of existing models for the broad and narrow emission line regions, small global BAL region covering factors generally demand that a single model must explain the broad and narrow emission lines and the BALs. Based on the framework of existing cloud component models and the constraints on BAL region geometry and kinematics that I have discussed, it seems most natural to interpret the BAL region as one of the cloud components in existing models for the emission lines. It is appropriate for theorists, therefore, to use results from BAL QSO studies to place additional constraints on existing models. Osterbrock and Mathews (1986) have recently given an excellent review of emission line regions of AGNs and QSOs. I do not discuss in detail results reported in their review. Instead I discuss how results from BAL QSO studies must be interpreted in the context of models which Osterbrock and Mathews (1986) discuss.
The main property of the BAL region which must be incorporated into the
framework
of existing models is that it lie beyond and be larger in total lateral
extent than an inner region producing the broad
Ly- emission line. Therefore,
the BAL region
and the broad Ly- emitting
region may be quite separate and distinct and they may
actually have a different origin. Additional evidence which supports
this view comes
from the facts that the BAL region can give rise to extensive observable
absorption,
whereas the broad Ly- emitting
region cannot, and that abundances inferred from
BAL region studies (see Section 3.6) are higher than
what is normally inferred from emission
line region studies. At the same time, it is clear that the BAL region
may give rise to
a component of the broad emission line region. For example, the BAL
region almost certainly gives rise to the broad NV emission line.
As Osterbrock and Mathews (1986) review, if the emission line region is assumed to be due to an outward flow of clouds, then there is considerable evidence which would suggest that the clouds closer to the central source have higher velocity than clouds farther out. This can be inferred, for example, from observations showing that the FWHM velocity of emission lines is larger for lines formed in higher density regions closer to the central source. In fact, the data on emission lines can be used to argue that the simple interpretation that the broad emission line region and the narrow emission line region are completely distinct from one another is an inadequate description of the observations. Osterbrock and Mathews (1986) suggest that in the narrow emission line region either the flow is decelerated outward, or else individual clouds are accelerated outward but those which form at larger distances reach smaller terminal velocities. They suggest that the broad emission line region merges with the narrow emission line region, even though the flow pattern in the broad emission line region is not as clear. As I reported in Section 3.5, in one type of BAL QSO there is evidence that the BAL region flow decreases outward, so results from BAL QSOs may be in qualitative agreement with this view. However, since BAL region densities are thought to be considerably higher than narrow emission line region densities (see Section 3.2), the BAL region apparently must be embedded somewhere within this normal broad/narrow emission line region flow.
One speculation is that a disk-like distribution of massive stars undergoing
supernovae-type explosions within the inner tens of parsecs may give
rise to a local region
which can cover and occult some inner region where practically all of
the Ly- broad
emission line is produced. Such a scenario might meet the requirement of
a small global
BAL region covering factor and a large local BAL region covering
factor, producing the
kind of aspect angle effects that are inferred from comparisons of BAL
and non-BAL
QSO properties. In the presence of a rapidly expanding thermal wind,
zabs > zem
from the BAL region may not be seen, because the wind would quickly sweep up
clouds injected into the flow. Some other source for the clouds giving
rise to the
broad Ly- and some other
emission lines would probably be necessary. This would
be an advantage, however, if one wanted to construct a model in which
only the BAL region abundances were significantly enhanced.
The actual distance between the central source and the region producing
the broad
Ly- emission line is important
to know, especially in the context of constraining the
size scale of the BAL region. In the original single component models
for the broad emission line region, the
Ly- emitting region was
constrained to lie ~ 1 pc from
the central source, because
CIII]1909 also had to be
produced in the same region
and this suggested that the density was < 1010
cm-3. However, it is now believed
that very inhomogenous conditions exist in the emitting region and no
such density
constraint should be rigorously imposed. Therefore, it is quite possible
that the Ly-
emitting region lies closer to the central source.