


What are the FBGs? A population of extreme blue galaxies is expected from metallicity production arguments: an estimate by Cowie, et al. (1988) suggested that star-forming galaxies would produce as much as 40% of the observed metals. Several lines of evidence imply that most of these blue galaxies, between 24 and 27 B magnitude, are distributed smoothly over a range of redshifts between 0.7 and 3. Babul & Rees (1992) argued that the majority of the FBGs may be dwarf ellipticals undergoing starburst at redshift about 1, most fading below detectability at the present epoch via supernova wind dispersal. Generally, models which introduce a new population of galaxies at high redshift have a sufficient number of additional adjustable parameters to fit the observed number counts.
Based on estimates of the local galaxy luminosity function Loveday, et al. (1992) conclude that the surface density of galaxies exceeds a no-evolution estimate by a factor of two by Bj = 20-21 mag; Colless et al. (1993) claim a factor of two excess by 22.5 Bj magnitude. Naturally these comparisons depend critically on the details of the models. Some models with evolution (Yoshii & Takahara 1988; Guiderdoni & Rocca-Volmerange 1990) underproduce the blue number counts in a flat universe. Other models, both with and without evolution, have claimed consistency with the observations (see below). A good review of this luminosity function problem is given by Bales (1993). There have also been claims, based on undefined evolution models, for a significant deficit of high redshift galaxies in the faintest redshift surveys. However, a mild evolution model shown in Figure 5 agrees well with the redshift data, but is not unique. Spectroscopy of a large sample of galaxies to 25th mag in many fields is required for the next step.

|
Figure 5. Number-redshift relation from the survey of Colless et al. 1993, together with a mild-evolution Bruzual model prediction including the surface brightness sample selection and lost-light corrections. No significant deficit of high redshift galaxies is seen. |
Not surprisingly each of these models confirms that a redshift survey to 23rd magnitude does not sample a significant fraction of the population of faint galaxies to 26th magnitude. There has been some confusion in the literature where, on occasion, galaxies between 21-23 B mag are called FBGs (mostly in reports of spectroscopic work, where it is difficult or impossible to go to fainter magnitudes). What should we expect for the redshift of a randomly chosen 24th to 26th magnitude galaxy? Figure 6 shows differential number-redshift counts at 24-26 B magnitude in a variety of recent models.

|
Figure 6. Predicted differential
number-redshift relation dN(z) / dLog z at magnitudes
24-26 Bj ( |
The expected number of galaxies per log redshift interval dN / dLog z
( Log z =
.04) for the
Log z =
.04) for the  = 0.1 C model of
Guiderdoni & Rocca
Volmerange (1990),
which does
not include a lost-light correction, are shown, together with one of our
mild evolution
models for = 0.2 and
H0 = 50. The
(,
= 0.1 C model of
Guiderdoni & Rocca
Volmerange (1990),
which does
not include a lost-light correction, are shown, together with one of our
mild evolution
models for = 0.2 and
H0 = 50. The
(,
 ) = (.2,.8), (.2,0) and (1,0)
models of
Yoshii et al. (1993)
are also shown. The (.2,.8) model yields 24-26 mag counts which are too
high. These models use slightly different luminosity functions. Models
corrected for
observational selection should be compared with raw data, while the
others should be compared with corrected data. See also
Carlberg & Charlot
(1992).
) = (.2,.8), (.2,0) and (1,0)
models of
Yoshii et al. (1993)
are also shown. The (.2,.8) model yields 24-26 mag counts which are too
high. These models use slightly different luminosity functions. Models
corrected for
observational selection should be compared with raw data, while the
others should be compared with corrected data. See also
Carlberg & Charlot
(1992).
A broad range of FBG redshifts is a feature of all these models and is less dependent on model parameters than the number-redshift relation at brighter magnitudes. Redshifts of 23 mag field galaxies in most models peak around z = 0.4, consistent with existing galaxy spectroscopic data. On the other hand, the bulk of the FBG population is over 16 times fainter (m > 26 mag) and samples redshifts up to 3. It is interesting that, given the very different parameters in these models, most FBGs are predicted to lie at z > 1. The non-evolution KGB93 model has the bulk of 24-25 B mag FBGs at redshifts above one.
3.1 Observed Distribution in Redshift
Redshift data will provide the only hope of disentangling the trends of galaxy mix, luminosity functions, evolution scenarios, and cosmology. Figure 7 shows the sum of all redshift surveys of field galaxies, excluding AGNs and QSOs, to date. The recent LDSS-2 (Glazebrook et al. 1993 survey at 23-24 mag is shown as filled circles. Overplotted are mean redshift lines from a mild evolution model, for three different galaxy types.

|
Figure 7. A plot of field galaxy redshift
vs. Bj magnitude, from all the redshift surveys
to date (adapted from
Koo & Kron 1992).
New survey data, including Ly- |
The trend to redshift  1 at
25th Bj magnitude is clear. Note that a typical galaxy
seen at z = 1 may be a 0.1 L* galaxy and that at 25th magnitude
there may be a wide
range in redshifts extending from 1-3. Ten meter and larger telescopes
will be required
to obtain redshifts of non-lensed galaxies fainter than 24th
magnitude. The Colless
et al. and Broadhurst, et al. redshift surveys imply that the comoving
number density
of galaxies brighter than about 0.1 L* was roughly three times
higher at z = 0.3 than now
(Bales 1993;
Lonsdale & Chokshi
1993).
In the absence of merging, many FBGs
must evolve to dwarf luminosities at the current epoch.
1 at
25th Bj magnitude is clear. Note that a typical galaxy
seen at z = 1 may be a 0.1 L* galaxy and that at 25th magnitude
there may be a wide
range in redshifts extending from 1-3. Ten meter and larger telescopes
will be required
to obtain redshifts of non-lensed galaxies fainter than 24th
magnitude. The Colless
et al. and Broadhurst, et al. redshift surveys imply that the comoving
number density
of galaxies brighter than about 0.1 L* was roughly three times
higher at z = 0.3 than now
(Bales 1993;
Lonsdale & Chokshi
1993).
In the absence of merging, many FBGs
must evolve to dwarf luminosities at the current epoch.
Although redshifts of individual galaxies fainter than 24th magnitude are generally not known, rough statistical limits have been set via gravitational lens image distortion in the case of several foreground massive clusters with independently determined masses. Thus, a lower redshift limit for these faint galaxies may be derived from their response to a gravitational lens placed in the foreground. A good test is provided by the dark matter lens in the well studied cluster 0024+16 (z = 0.39). Roughly the same number of FBGs per square arcminute are seen behind these red clusters, but their images are stretched by the gravitational lens and are aligned orthogonal to the vector to the cluster center. We take this as evidence that most of the background galaxies are at redshifts larger than 0.7.
An upper redshift limit for these FBGs may be determined from its spectral energy distribution over the wavelength range 0.3-1 µm, and the discontinuity in the spectrum of stars and galaxies at the Lyman break of hydrogen at 912 Å (Guhathakurta et al. 1990). Most of these faint galaxies appear to have a redshift less than three. If a significant fraction of these galaxies were at redshift greater than 2.8, the Lyman break would be shifted through the 0.32-0.36 µm "U" passband, causing these galaxies to either drop out in this U band or to have a drop in flux between Bj (0.37-0.5 µm) and U wavelengths. Lyman breaks from most stars in these primeval galaxies are probably at least a factor of two. In addition, these galaxies would have even more hydrogen than present galaxies, which would absorb all the Lyman continuum photons, causing these galaxies to be black in the U-band for redshifts larger than 3. This Lyman break has recently been seen by Dickinson & Spinrad in the spectrum of a bright galaxy associated with a radio source at redshift 3.8.
When surface brightness effects are taken into account, detected galaxies at high redshift arc expected to be sub-L* in all models. When combined with the additional expected magnitude-size correlation, model scale lengths decrease monotonically with apparent magnitude. Galaxies at 26-27th magnitude are observed to have half-light diameters approaching twice the stellar point-spread function. Thus, it is possible to get some statistical information on the average radial profile of the FBGs, at a given magnitude, by making use of the observed stellar point spread function obtained from brighter stars in the same image. After seeing deconvolution (Tyson et al. 1993) galaxies fainter than 26 Bj mag are found to have average exponential scale length 0.2-0.5 arcsec. The raw intensity profile of an average of 100 25th B mag galaxies is shown in Figure 8 along with the stellar PSF.

|
Figure 8. The raw profile of an average 25th B mag galaxy is shown, along with the stellar PSF. In each magnitude bin an integral deconvolution technique minimizes sensitivity to noise in solving for the deconvolved exponential scale. |
What fraction of faint galaxies are low surface brightness galaxies? A search of the deep CCD catalogs for objects classed as "diffuse" turns up less than 5% of all galaxies in the magnitude range 23-26 Bj. Monte Carlo tests in which we insert low surface brightness galaxies finds them efficiently, so that these kind of galaxies are probably not missed in the deep CCD surveys, although nearby versions of them would be missed because their angular size would be larger than the chopping angle in the shift-and-stare observations. Galaxies of 26th B, mag appear to be somewhat more extended in comoving metric size than brighter galaxies at low redshift, roughly like (1 + z).
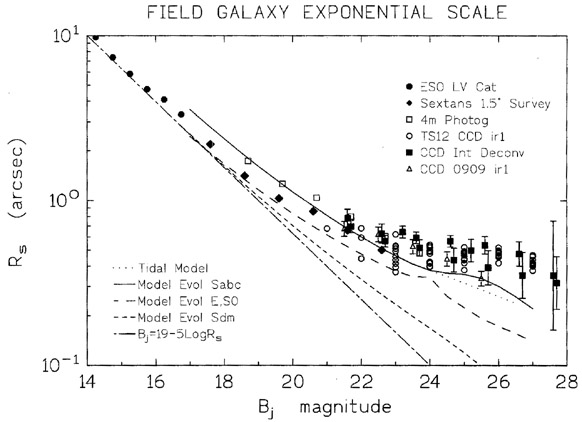
Galaxy angular scale data from a number of sources are shown in Figure 9, in which the best fit exponential scale radii are plotted vs. total Bj magnitude. Two methods of PSF deconvolution were used: (1) PSF quadrature subtraction using the cataloged first radial moments of the intensity profiles of stars and galaxies, and (2) maximum likelihood solution of a Bayesian integral PSF convolution with an exponential profile. Monte Carlo seeing simulations were used to test these methods. Using 120,000 galaxies to 25th mag and 15,000 to 27th Bj mag we find, to surface brightness 29 Bj mag arcsec-2, an average "half-light" (half total luminosity) radius of 0.86" for Bj = 23-24, and 0.7" for Bj = 25-26. The former is not too different from preliminary results from the HST Medium Deep Survey parallel observations (Griffiths et al. 1993).
|
Figure 9. Data and simple models for the seeing-deconvolved angular exponential scale radius as a function of apparent Bj magnitude. The angular scale length does not show the classic minimum, even as a function of redshift, due to surface brightness dimming. There is no evidence for any color-band dependence of Rs. |
Plotting a mean value for Rs is perhaps misleading since, in a given magnitude bin each survey field shows a large range of Rs values significantly in excess of noise. In addition to the mix of all types in such an average, which tends to lower the best fit scale lengths below their value for a spiral-only sample, there is the question of disturbed morphology. While some galaxies may exhibit a disturbed morphology with multiple peaks, the average scales shown in Figure 9 represent the composite scale of the galaxies. The lines plotted in Figure 9 show schematically the behavior of the scale length in simple single population mild luminosity evolution models for several types of galaxies. Model comoving sizes are multiplied by 1 + z to account roughly for collapse of the star forming region. A tidally triggered galaxy formation model of Lacey et al. 1993 is also shown; this is not significantly different from the scale lengths of spiral galaxies in the mild evolution model, but their colors in this magnitude range are more than 1 mag redder than the data shown in Figure 4. The bump in Rs for the mild evolution model at 24-26 mag is due to higher SFR at z = 1-2 (see model curves in Figure 7), which also produces the bump in the counts similar to that seen in Figure 3.
Broadhurst et al. (1988),
and more recently
Cowie et al. (1991)
and Babul & Rees (1992),
suggested that the FBGs may be dwarfs undergoing starburst which have faded
below detection in recent times. Starbursting dwarf galaxies at high
redshift tend to have exponential scale radii less than 0.1 arcsec (see
Carlberg & Charlot
1992),
so that the FBGs are not likely to be these unless star formation in
dwarf galaxies at z = 1 takes
place over a very much larger comoving volume than in nearby dwarfs. In
place of the observed local LF,
Koo et al. (1993)
have proposed an = 0.1
no-evolution model
which chooses from 154 combinations of absolute magnitude and color
class, attempting
a match to N(m) and color data; this leads them to unusual LFs. They
effectively
increase the numbers of Sdm type at moderate redshift (.5-1) and thus
would predict
very small sizes for the majority of faint galaxies (bottom curve in
Figure 9).
Parametrizing a typical high redshift galaxy by a single scale length may be misleading if these objects have disturbed morphology with multiple peaks within 1-2 arcsec. Such objects would have large apparent average scale lengths. Baron & White 1987 showed that in CDM theory the properties of the FBGs are consistent with their being primeval galaxies at z = 2-3, with formation continuing to z = 1-2. While their large scale lengths are borne out by the data shown in Figure 9, their model counts fall below the observed counts. The morphology of these model forming galaxies is diffuse and complex by comparison to nearby galaxies, a result which is not in disagreement with the data. Recent HST WFC deep parallel data show galaxies at 23-24 mag with a higher incidence of disturbed morphology than in brighter samples (Windhorst et al. 1993). But a large fraction of FBGs would have to have a disturbed morphology to bias the deconvolved scales shown in Figure 9. It will be interesting some day to obtain imaging of individual FBGs with 0.1" resolution at 29 mag arcsec-2 surface brightness.
Are there trends in the seeing-deconvolved principal axis ratio of galaxies with magnitude? We have studied the faint galaxy ellipticity distribution for field and cluster galaxies. The FBGs have considerably higher ellipticities than equally faint galaxies in clusters. Only about 10% of the faint field galaxies have observed (uncorrected for PSF) ellipticities less than 0.2. When corrected for seeing, the axis ratios increase even further. Nevertheless, the observed ellipticity distribution of the FBGs after PSF deconvolution is not significantly different than that of the nearby population of field galaxies, which is dominated by spirals. This may suggest that disks have been forming over a wide range of look-back times. Finally, it must be mentioned that the large average galaxy scale lengths shown in Figure 9 are easily accommodated in a cosmology with positive cosmological constant, a model which produces very large counts and is also consistent with correlation data (Efstathiou et al. 1991; Yoshii et al. 1993).
The nature of the FBG population(s) will also be constrained by their angular
and spatial correlations
 (
( , mag) and
 (r,
z). Clustering is type dependent; nearby
late-type spirals have nearly a factor of four lower clustering
amplitude than early type galaxies
(Giovanelli et
al. 1986).
Like the clustering at the current epoch, the red
galaxies at z = 0.3 appear to be more strongly clustered than the blue
galaxies
(Bernstein et al. 1993);
this red/blue difference in clustering is shown in
Figure 10 for a large sample
of 20-23 mag galaxies for which the redshift distribution is known.
(r,
z). Clustering is type dependent; nearby
late-type spirals have nearly a factor of four lower clustering
amplitude than early type galaxies
(Giovanelli et
al. 1986).
Like the clustering at the current epoch, the red
galaxies at z = 0.3 appear to be more strongly clustered than the blue
galaxies
(Bernstein et al. 1993);
this red/blue difference in clustering is shown in
Figure 10 for a large sample
of 20-23 mag galaxies for which the redshift distribution is known.

|
Figure 10. The two-point correlation
function vs. redshift for galaxies in various
surveys (from
Bernstein et al. 1993).
Pairs of lines labeled |
The clustering at z = 0.3 is about half the
(r =
250h-1 kpc) seen in nearby galaxies,
yet quite similar to the clustering of nearby IRAS galaxies. This
stronger correlation
at redder wavelengths was also observed in our very faint data
(Efstathiou et
al. 1991);
this implies, not surprisingly, that redder types which are at lower
redshift are being
selected in the red band. Perhaps the FBGs are progenitors of the IRAS-selected
population. The amplitude of the FBG correlations fall below predictions
of theories
of linear growth of structure at the faint high-redshift end. By 26th
Bj magnitude the
amplitude of w(30 arcsec) is ten times lower than linear CDM,
even if most of the 26
mag galaxies are put at redshifts approaching 3
(Efstathiou et
al. 1991).
But this may
not necessarily imply an additional population of fading unclustered FBGs.
Yoshii et al. (1993)
have compared the correlation data on faint galaxies with
N-body simulations which are allowed to go non-linear. Although is it
always impossible
to identify the present epoch in such simulations, they find good
agreement with
observations in a simulation with low bias. Both highly biased CDM and
open models
disagree significantly with the clustering observations. CDM-like models
with power on
large scales may be consistent with these data; then merging enhances
early nonlinear growth of correlations
(Melott 1992),
corresponding to a value of the clustering growth
parameter  larger than 0;
i.e. more clustering than fixed in proper coordinates. To
Bj < 22.5 mag the evolution in clustering of blue
galaxies appears to be due to an
increasing fraction of late type or star-forming galaxies at the faint
end, combined with
weaker small-scale clustering for late types. These blue galaxies appear
to be clustered
more like scaled predecessors of the IRAS galaxies. This similarity may
suggest
ongoing starburst activity. Merging scenarios, even if self-similar, do
not solve both the
low correlation and high density problems. Since low redshift dwarf
galaxies are highly
correlated with low redshift L* galaxies, which are themselves
highly correlated, this
very low correlation for the FBGs rules out the possibility that a
substantial fraction of the FBGs are nearby dwarfs.
larger than 0;
i.e. more clustering than fixed in proper coordinates. To
Bj < 22.5 mag the evolution in clustering of blue
galaxies appears to be due to an
increasing fraction of late type or star-forming galaxies at the faint
end, combined with
weaker small-scale clustering for late types. These blue galaxies appear
to be clustered
more like scaled predecessors of the IRAS galaxies. This similarity may
suggest
ongoing starburst activity. Merging scenarios, even if self-similar, do
not solve both the
low correlation and high density problems. Since low redshift dwarf
galaxies are highly
correlated with low redshift L* galaxies, which are themselves
highly correlated, this
very low correlation for the FBGs rules out the possibility that a
substantial fraction of the FBGs are nearby dwarfs.
Deep imaging of a 1.5 degree field with 120,000 detected galaxies to 26
Bj magnitude
lets one follow
() over a wide range
(Postman et al. 1993).
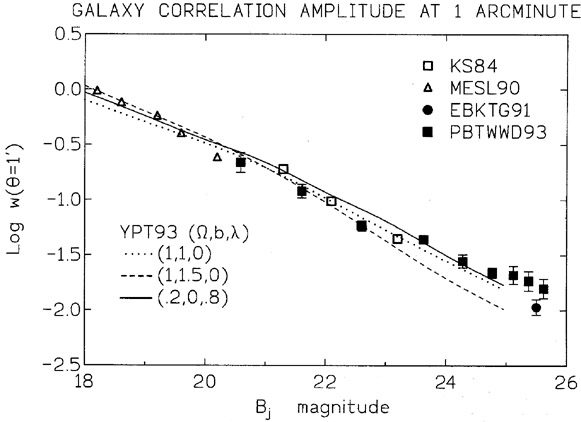
Figure 11 shows the
amplitude of (1 arcmin) as a
function of Bj magnitude from 18th to 26th mag. The
monotonic decrease to the small correlations at 25.5 mag reported in
Efstathiou et al. (1991)
for several small CCD fields is clearly seen.
|
Figure 11. Observations of the amplitude of the galaxy-galaxy angular correlation at one arcminute is shown vs. Bj magnitude. The solid triangles are data from a 1.5 square degree field containing 120,000 galaxies. The various theoretical curves are discussed in the text. |
Also shown in Figure 11 are data from
Maddox et al. (1990)
[open triangles] and
Koo & Szalay (1984)
[open squares]. The curves are from N-body simulations by
Yoshii et al. (1993):
(, bias,
) (1,1,0) dotted, (1,1.5,0)
dashed, (.2,0,8) solid. The
(, m) data alone cannot distinguish between these
three models, but the observed
amplitude is much lower than either highly biased CDM models or open
models with zero cosmological constant.
Most models of structure formation show some increase in correlation amplitude at the faint end (Carlberg & Charlot 1992) whereas the observations at the faint end follow a simple power law. Introducing interaction-induced starburst in these models makes no significant change in the correlation amplitude for FBGs. Perhaps many FBGs are being seen during initial starburst activity at an early epoch, before nonlinear clustering. In any case, models for FBGs which attempt to account for the high surface number density and very low correlation are forced into a maximal redshift distribution extending at least to z = 3.
Is the sky similarly crowded with faint galaxies at K band? It is conceivable that there was some early stellar burning at redshifts higher than 6 (so as not to exceed the observed 0.9 µm galaxy counts) substantially raising the K-band counts and total flux. If there were a bright phase of stellar burning at redshift about 10-20 (population 3 stars), they would be seen in a deep K-band survey. The new HgCdTe area imagers may well create as much of a revolution in K-band imaging as the silicon CCDs have in the optical, but deep surveys to date using these devices have covered an area of only one square arcminute at 22nd K magnitude (Gardner et al. 1993).
In going from the optical wavelengths to the near-IR to obtain galaxy counts, the initial hope was that one would be rid of the uncertain K-corrections from the unknown far UV portion of galaxy spectra that might affect our understanding of the blue counts. However, even K-selected galaxies turn out not to be at terribly high redshifts. For example, for a typical galaxy at a redshift z = 0.5 the rest wavelength corresponding to the 2.2 µm K-band is about 1.5 µm, and little is known about the current-epoch luminosity function of galaxies at 1.5 µm. So that even no-evolution predictions are difficult to make for the K-band. Dusty primevals may be mixed with the large numbers of FBGs. In this connection, it is perhaps significant that we do not see many very red objects at faint I or K magnitudes. Either there was negligible galaxy formation (proto-ellipticals and proto-bulges) for z > 5, or there was adequate dust from a very much earlier star formation epoch to hide that luminous phase. But that much dust would seriously lessen the likelihood of finding z = 4-5 QSOs. The counts at the faint end of the K-band data are surprisingly low, given the I-K color of somewhat brighter galaxies within the combined completeness limits. Given the extreme blue colors of K-selected galaxies, it would follow that B-selected galaxies would have even bluer colors, due to color selection bias; the FBGs dominate the bluer passbands. Yoshii et al. (1993) point out that standard models of luminosity evolution of a single population of evolving galaxies cannot reproduce both the K-band counts and the I-band counts with the same model parameters, independent of assumed cosmology.
Will it be possible to constrain cosmological models with number-magnitude N(m)
counts of these faint galaxies? Speculation on the nature of these FBGs
has ranged from
low redshift dwarf galaxies undergoing star formation, to high redshift
primeval galaxies
forming the majority of their initial stellar population. There now
exist a variety of
models consistent with most observations with different evolution
scenarios, including
various stellar formation histories, merging, galaxy luminosity
functions, stellar initial
mass functions, and cosmological parameters. Without number-redshift
data little if
any cosmological information can be uniquely determined from the
number-magnitude-color
counts alone. Under restricted model scenarios in which the shape of the galaxy
luminosity function is assumed invariant, stellar formation begins at
some universal
epoch (different for spirals and ellipticals), and the arbitrary
assumptions of no merging
and no episodic star formation, various authors have remarked that it is
difficult to fit
the observed galaxy counts with a high value of the cosmological density
, the
number-magnitude counts exceeding evolution model counts for
= 1 at 27th magnitude by
a factor of ten
(Bruzual 1987;
Arimoto & Yoshii 1987;
Tyson 1988;
Yoshii & Takahara 1988).
Through the effect of volume, changes in cosmology affect the numbers of
galaxies
seen at some redshift N(z). In general, galaxy number-magnitude counts N(m) are
relatively more sensitive to evolution, and number-redshift counts are
more sensitive
to cosmology. The unavoidable result is that we will never be able to
conclude much
of interest cosmologically from galaxy number-magnitude counts without
also having
good number-redshift information complete to the same surface
brightness. Even then,
we will have to know something about the shape of the galaxy luminosity
function vs.
redshift. It is illuminating to play with evolution models, relaxing the
assumption of
invariant luminosity function, introducing appropriate observational
selection, episodic
SFR, and/or merging. While it is possible to fit the observed N(m,
 )
with low and
the traditional models, it is also possible to get a good fit by varying
the faint tail of the
luminosity function vs. look-back time or introducing galaxy number
non-conservation.
)
with low and
the traditional models, it is also possible to get a good fit by varying
the faint tail of the
luminosity function vs. look-back time or introducing galaxy number
non-conservation.
Merging models (galaxy number non-conservation) have been proposed by
White 1989,
Cowie et al. 1991,
and Broadhurst et
al. 1992.
But in a merging galaxy model
which properly includes observational selection effects,
Yoshii (1993)
finds too few counts at 24-26 mag by a factor of 3-4 in a
(,
) = (1,0) model. There is also a
problem getting rid of enough galaxies by merging:
Dalcanton (1993)
has shown that only 5-15% of the mass in galaxies at z = 0.35 can have
merged into the local population
of ellipticals and spirals. To search for merging at z = 0.3 very long
exposure HST
imaging will be helpful, particularly if redshifts of the galaxies can
be obtained. It is
perhaps risky to argue that irregular 2-dimensional morphology implies
merging since
there are several other expected mechanisms for this morphology in deep images.
At this time, we know even less about the nature of galaxies at z = 1
than we do
at z = 0.3, where model calculations already extrapolate galaxy
luminosity functions
eight magnitudes below L*. General galaxy evolution models have
more adjustable parameters than necessary for a good fit to the N(m,
) data. This situation changes
when we have observational constraints on the N(z) distribution, and it
will perhaps
be possible in coming years to obtain corresponding rough constraints on
using these
N(z) constraints together with some limits on the luminosity evolution.
Koo et al. (1993)
have proposed a no-evolution model which instead changes the mix of galaxy
types as a function of redshift.
Lacey et al. (1993)
have a tidal interaction model.
Models which have been successful in explaining some data have been less
compatible with other kinds of data on the FBGs. My Bruzual model
(1988) predicts evolving
bright ellipticals which probably should have been seen in redshift
surveys of selected
objects at 24th mag; faint galaxies in the heuristic Koo et al. model
are too blue and
probably too small; the Lacey et al. model gives colors which are far
too red. Moreover,
most models assume a single time-invariant luminosity function. In any
case, the total
EBL is an integral over redshift of all sources of luminosity and is
less sensitive to cosmology.
 surveys and lens arc surveys, have been added. Note the absence of a
dominant population of
extreme dwarf galaxies at the faint end. The band (dashed lines)
between redshifts 1.2
and 1.8 is excluded from ground based surveys due to inaccessibility of
Ly-
surveys and lens arc surveys, have been added. Note the absence of a
dominant population of
extreme dwarf galaxies at the faint end. The band (dashed lines)
between redshifts 1.2
and 1.8 is excluded from ground based surveys due to inaccessibility of
Ly-