


5.3.4 Host Galaxies
A simple test of unification is that the morphology and magnitude of radio galaxies and quasar host galaxies be comparable. At present the observational situation for quasars and FR II radio galaxies is not entirely clear, as comparisons of their mean host galaxy luminosities have led to conflicting conclusions. Some studies have found radio galaxies to be fainter by ~ 0.5-1 magnitude (Hutchings 1987; Smith and Heckman 1989), while others concluded the mean magnitudes (and dispersions) were comparable (Véron-Cetty and Woltjer 1990; Lehnert et al. 1992). In part, determining quasar host galaxy magnitudes is difficult, and in part the differences between the conflicting results may be explained by systematic effects (Abraham et al. 1992) and/or by incomplete or heterogeneous samples. For example, in the present unification scheme the parent population consists of luminous narrow-line radio galaxies, yet samples of ``powerful radio galaxies'' used to test unification sometimes include broad-line radio galaxies (the local counterpart of quasars) and FR Is.
With high-resolution ground-based imaging, host galaxies have been detected in quasars out to a couple of gigaparsecs. Figure 8 shows a CFHT image of the radio-loud quasar 2135-147, which has redshift z = 0.2. Even though the quasar nucleus is very bright, the host galaxy is clearly visible, as are companion objects ~ 2 arcsec and ~ 5 arcsec to the east (Hutchings and Neff 1992). Most quasars are at higher redshift, so determining whether they are in ellipticals requires high resolution imaging of the kind now available with HST (Hutchings et al. 1994; Hutchings and Morris 1995; Bahcall et al. 1995). Such studies of the galaxy morphologies of large, complete samples of quasars and radio galaxies will be important for testing unified schemes.

|
| Figure 8. Optical image of the radio-loud quasar 2135-147 obtained with the CFHT with resolution 0.5 arcsec. The host galaxy is clearly visible, as are two close companions ~ 2 arcsec and ~ 5 arcsec to the east (Hutchings and Neff 1992; copyright American Astronomical Society, reproduced with permission). |
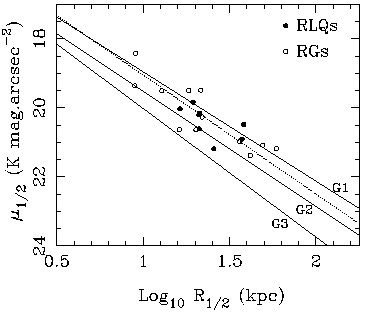
Most host galaxy studies have been done at optical wavelengths,
where the ratio of nuclear to galaxy flux is relatively high.
Diffuse stellar light surrounding bright AGN is more easily detected
in the infrared; for example, the K-band images of 2135-147, the quasar in
Fig. 8, also show the diffuse galaxy
emission and companion objects quite clearly, if not at the same
resolution
(Dunlop et al. 1993).
A recent infrared comparison of
radio galaxies and radio-loud quasars at z  0.4,
matched in radio power and redshift, shows that the host galaxies of both
classes appear to be luminous ellipticals, have the same average half-light
radii, and have the same mean absolute magnitudes
(Dunlop et al. 1993;
Taylor et al. 1995).
For both the radio galaxies and quasars,
infrared galaxy surface brightness and scale length are well correlated
(Fig. 9), with the same slope and normalization as for
brightest cluster galaxies
(Schneider et
al. 1983).
This gives strong support to the unified scheme, at least for relatively
nearby quasars.
0.4,
matched in radio power and redshift, shows that the host galaxies of both
classes appear to be luminous ellipticals, have the same average half-light
radii, and have the same mean absolute magnitudes
(Dunlop et al. 1993;
Taylor et al. 1995).
For both the radio galaxies and quasars,
infrared galaxy surface brightness and scale length are well correlated
(Fig. 9), with the same slope and normalization as for
brightest cluster galaxies
(Schneider et
al. 1983).
This gives strong support to the unified scheme, at least for relatively
nearby quasars.
|
| Figure 9. The distribution of radio galaxies and the host galaxies of radio-loud quasars on the K-band µ1/2, logR1/2 plane, where µ1/2 is the K-band surface brightness at the half-light radius, R1/2 , for samples matched statistically in redshift and radio power to minimize selection effects. Both radio galaxies and quasar hosts are very luminous and have large scale lengths; the best fit correlation for the combined dataset (dotted line) is very similar, in both slope and normalization, to those for brightest cluster galaxies (solid lines; from Schneider, Gunn and Hoessel 1983, shifted to the K-band by the observed mean zero-redshift color of the radio galaxies in the sample, B - K = 3.75). The properties of radio galaxies and quasar hosts on this diagram are statistically indistinguishable, lending strong support to unified schemes, at least for z < 0.4 (Taylor et al. 1995; figure courtesy of James Dunlop). |