

2.1.3. Diagnostic diagrams and composite nuclear spectra
shown empirically that several combinations of
easily-measured emission lines can be used to separate emission line galaxies
into three categories according to the principal excitation mechanism: nuclear
H II regions or starbursts, Seyfert 2s and Liners
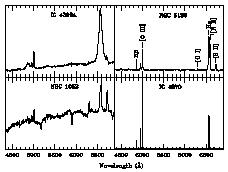
(Fig. 2
shows typical spectra of a Seyfert 1, a Seyfert 2, a Liner and a starburst
galaxy). They found that the three groups can be effectively segregated using
plots of [N II]
 6583 /
H
 vs [O III]
 5007 /
H
 and
of [O II]
 3727 /
[O III]
 5007 vs
[O III]
 5007 /
H
 ,
[N II]
 6583 /
H
 , or
[O I]
 6300 /
H
 .
.
Veilleux & Osterbrock (1987) have proposed a revised method of
classification involving the line ratios
 5007 /
H
 ,
,
 6583 /
H
 ,
[S II]
 6717,6731 /
H
 and
and
 6300 /
H
 . These
line ratios take full advantage of the physical distinctions between the
various types of objects and minimize the effects of reddening correction and
calibration errors. The
 6583 /
H
 ,
,

 6717,6731 /
H
 and
and
 6300 /
H
 ratios are well
correlated with each others
([199]),
therefore all these diagrams
should basically lead to the same classification.

|
Figure 2. Spectrum of a Seyfert 1 nucleus (IC 4329A), a Seyfert 2 nucleus (NGC 5135), a Liner (NGC 1052) and a high excitation starburst galaxy (IC 4870). These four spectra have been taken with the ESO 1.5m telescope. |
The use of Veilleux & Osterbrock (1987) diagnostic diagrams generally yields an immediate classification of the nuclear emission line clouds; ``transition'' objects however exist which cannot be classified unambiguously from their line ratios ([438]). When observed with sufficient spectral resolution, such objects show different profiles for the lines, this being due to the superposition of several components that have different relative strengths and are kinematically and spatially distinct, usually a H II region and a Seyfert cloud; they have a ``composite'' spectrum ([298]; Gonçalves et al. 1999).
Fig. 3 shows the Veilleux & Osterbrock diagnostic diagrams for a large number of nuclear emission line galaxies with published line ratios, excluding objects which have been shown to have a composite spectrum; we have empirically drawn lines enclosing regions containing H II regions, Liners and Seyfert 2s.
Diagnostic diagrams using near-IR lines such as
[O II]
 7320,7330
and [S III]
 9069,9531 also provide a powerful
method in classifying emission line galaxies
([328]).
Several emission features in the mid-infrared (MIR) allow to distinguish
between starbursts and AGNs. The 7.7µm ``polycyclic aromatic
hydrocarbon''
(PAH) emission feature is strong in starbursts and weak in AGNs
(Lutz et al. 1998; 1999). On the other hand, the high-excitation lines
[O IV] 25.9µm and
[Ne V]
 14.3µm are
strong relative to
[Ne II]
 12.8µm in
AGNs and weak in starbursts
([139];
[450]).