


5.2 Rotation Curves for Spiral Galaxies in Clusters
Without detailed information about the orbits of stars in elliptical galaxies, it is not possible to determine the distribution of mass in these types of galaxies (Tremaine and Ostriker 1982). The measurement of circular velocities in the disks of spiral galaxies provides a much better tool for determining the distribution of mass. It is also easier to measure the position of strong emission lines rather than the shape of weak absorption lines. While velocity dispersion curves generally only extend to a few tenths of the radius at the 25th mag arcsec-2 B isophote, R25, optical emission-line rotation curves typically reach to 1.0 R25, and 21 cm rotation curves often extend two or three times as far.
With all the interest in the possibility that the cluster environment may affect the structure and dynamics of galaxies, it is surprising that it has only been during the last few years that a sample of extended emission-line rotation curves has become available for galaxies in these dense environments. Based on limited optical material, Chincarini and de Souza (1985) concluded that there was no qualitative difference between the rotation curves of 10 spiral galaxies in clusters and the rotation curves of field spirals. However, their rotation curves generally only extended to a few tenths of R25, and were generally for galaxies far from the core of the clusters.
Burstein et al. (1986) used observations of 20 spirals in four clusters from Rubin, Whitmore, and Ford (1988) to show that there was a difference in the distribution of mass curves (i.e., the integral mass derived from the rotation curve) between cluster and field galaxies. They found that one-third of the galaxies in the field are mass type I (i.e., the inner and outer gradients of the mass curve are most similar), but none of the 20 spirals in the cluster sample are mass type I. Forbes and Whitmore (1989) have confirmed this effect using a more objective chi-squared method to determine the mass types.
Rubin, Whitmore, and
Ford (1988)
recently presented extended emission-line
rotation curves for 21 galaxies in four large spiral-rich clusters;
Cancer, Hercules, Peg I, and DC 1842-63. They examined the correlations
between the four global properties:
luminosity, radius, maximum rotational velocity, and mass. Perhaps the most
interesting result was the finding that the Tully-Fisher relationship
(Tully and Fisher 1977)
between maximum rotational velocity and luminosity may be
different for cluster
galaxies than for field galaxies. Cluster galaxies tend to have lower
rotational velocities
than their counterparts in the field with the same luminosity and
type. This is only a
2 result, and since a variety
of systematic effects are possible (e.g., internal extinction
may be less in cluster galaxies, cluster galaxies may be typed too early
with respect
to field galaxies, large scale motions of the cluster relative to the
smooth Hubble flow may be present) the result must be considered tentative.
Djorgovski, deCarvalho,
and Han (1989)
also find evidence that the slope of the Tully-Fisher relation may depend
on various cluster properties such as the velocity dispersion and
richness class.
result, and since a variety
of systematic effects are possible (e.g., internal extinction
may be less in cluster galaxies, cluster galaxies may be typed too early
with respect
to field galaxies, large scale motions of the cluster relative to the
smooth Hubble flow may be present) the result must be considered tentative.
Djorgovski, deCarvalho,
and Han (1989)
also find evidence that the slope of the Tully-Fisher relation may depend
on various cluster properties such as the velocity dispersion and
richness class.
The measurement of the shape of the rotation curve, and hence, the distribution
of mass in the galaxies, is much less problematic than the determination
of the global
properties. Uncertainties such as corrections for extinction,
inclination, or the motion of
the cluster, are not relevant. In Whitmore, Forbes, and Rubin
(1988;
hereafter WFR)
the shape of the cluster rotation curves are parameterized using various
gradients.
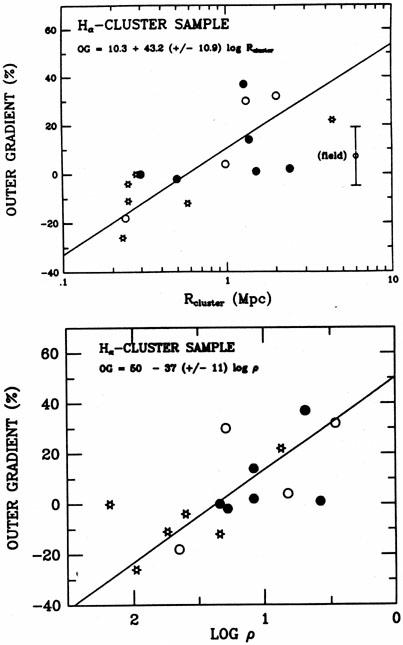
The most dramatic correlation is found using the outer gradient (OG),
which is the
percentage increase of the rotation curve between 0.4 R25 and
0.8 R25, normalized to
the maximum rotational velocity. Figure 5a shows
the correlation between OG and
Rcluster. A clear trend exist between these two properties,
with a probability of 99.9%
that OG and Rcluster are correlated. The average value of OG
for the field sample is
also indicated with error bars showing the
1 scatter of the
distribution. The rotation curves for galaxies near the centers of
clusters tend to have falling rotation curves in
their outer regions. Galaxies farther from the cluster center, or in the
field, tend to
have flat or rising rotation curves. Figure 5b
shows the correlation of OG with the
local projected galaxy density in an attempt to determine whether the
fundamental
parameter is a global or local property. It is currently impossible to
determine which
correlation is better with the small number of galaxies in the sample.
|
Figures 5a. and 5b. a) Outer gradient of
the rotation curve versus the projected
distance from the center of the cluster. (from
WFR 1988)
b) Outer gradient versus the
projected local galaxy density. Open circles are Sa galaxies; filled
circles are Sb galaxies;
and open stars are Sc galaxies. The average value of OG for the field
sample is included
with error bars showing the 1 |
Has the dark halo been stripped, either by tidal interactions with other galaxies or with the mean gravitational field of the cluster? Perhaps the inner cluster environment never allowed the galaxy to form a halo, or modified the halo properties as the proto-galaxy was forming (e.g., Zurek, Quinn, and Salmon 1988). Miller (1988) has argued that a severe "shaking" of a galaxy as it passes through the high density core of a cluster may be sufficient to rearrange the distribution of mass into a more elliptical-like distribution without actually adding or removing much mass.
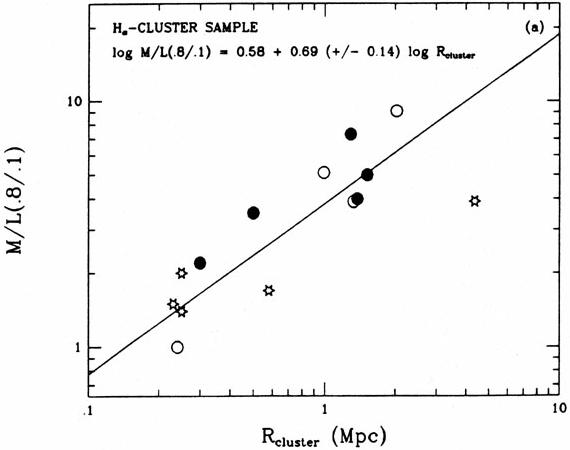
To address these questions, WFR calculated integral mass-to-light gradients (M/L = V2R/L). Figure 6 shows the M/L gradients from 0.1 R25 to 0.8 R25 versus the clustercentric position. WFR find that the inner cluster galaxies have flatter M/L gradients than the galaxies in the outer regions of the cluster. If a strong gradient in M/L is indicative of a large fraction of dark matter in the outer regions of a galaxy, then the present sample provides evidence that the galaxies near the centers of clusters have a lower fraction of their mass in the form of dark matter than the galaxies in the outer regions. This is consistent with the finding of falling rotation curves for inner cluster galaxies, again suggesting that a sizeable halo does not exist for them.
|
Figure 6. Integral mass-to-light gradients from 0.1 R25 to 0.8 R25 versus Rcluster. Same symbol definition as Figure 5. Steeper M/L gradients are found in galaxies in the outer regions of the clusters. (from WFR) |
More realistic mass models which use the observed distribution of light to predict the detailed rotation curve (e.g., Kalnajs 1983, Kent 1986, 1987, 1988) have shown that the amount of dark matter required to explain the observed rotation curve of field galaxies may be somewhat less than previously believed. In some cases the predicted shape is only slightly different than would be predicted by the luminosity profile. Some people have taken this as evidence that these galaxies do not require any dark matter. Although the fit is reasonably good for the inner regions of the galaxies, and even fairly far out in many cases, it is important to note that the predicted gradients in the outer part of the rotation curves are clearly below the observed value in about 60% of the galaxies, as opposed to about 10% where the predicted curve is clearly higher than the observed rotation curve. Hence, there is actually ample evidence that a dark component is required from Kent's models, albeit perhaps not as massive as previously believed. We should also note that Kent's (1987) study of galaxies with more extended HI rotation curves clearly shows the presence of a massive dark halo, even well within R25.
Guhathakurta et al. (1988) have obtained 21 cm observations at the VLA for 21 galaxies in the Virgo cluster. They conclude that the rotation curves for cluster galaxies are qualitatively similar to field galaxies. However, the rotation curves for the galaxies near the center of the Virgo cluster generally do not extend beyond a few tenths of R25 since they are HI deficient, making it difficult to make any meaningful comparison in this critical region. In addition, the poor spatial resolution of the radio observations (beamwidth = 45" for most of the observations) makes the comparison uncertain. After eliminating the galaxies where resolution in questionable, WFR find that the radio data follows essentially the same relationship between OG and Rcluster as the optical emission-line data, although the lack of many galaxies near the center of the cluster makes the relationship much less compelling.
Although the presence of falling rotation curves for central cluster
galaxies appears
to be significant at about the 4
level, we should keep in mind that it is based on only
a half dozen galaxies near the centers of clusters. A larger sample is
needed before we should consider this a firm result.