As noted above, the Poisson distribution is obtained as an asymptotic limit of the binomial distribution when p is very small. The result is
where µ = np, as before, and 0! is understood to be 1.
This distribution is determined by one rather than two
constants:
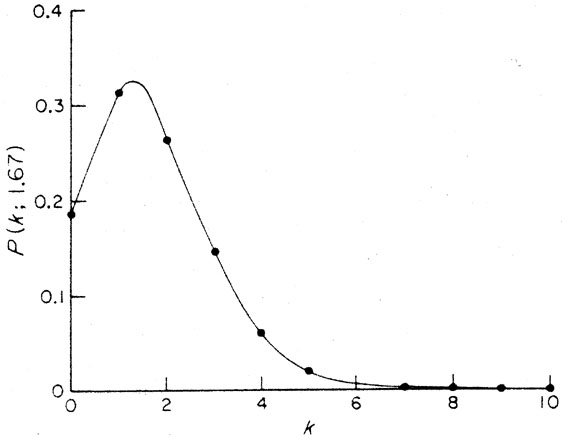
Figure A.6. The Poisson distribution
P(k;1.67). The mean value is
1.67, the standard deviation 1.29. The curve is similar to the binomial
distribution shown in Fig. A.4, but
it is defined for values of k > 10.
For example, P(20;1.67) = 2.2 x 10⁻¹⁵.
 =
(npq)1/2, but q = 1 - p
=
(npq)1/2, but q = 1 - p
 1,
so =
(np)1/2 = µ1/2. The standard
deviation is equal to the
square-root of the mean. The Poisson distribution is
discrete: P(0; µ) = e-µ is the
probability of 0 successes, given
that the mean number of successes is µ, etc. The probability
of 1 or more successes is 1 - P(0; µ) = 1 -
e-µ. The distribution P(k; 1.67) is
shown in Fig. A.6.
1,
so =
(np)1/2 = µ1/2. The standard
deviation is equal to the
square-root of the mean. The Poisson distribution is
discrete: P(0; µ) = e-µ is the
probability of 0 successes, given
that the mean number of successes is µ, etc. The probability
of 1 or more successes is 1 - P(0; µ) = 1 -
e-µ. The distribution P(k; 1.67) is
shown in Fig. A.6.