


I will begin by describing the results of radio observations, where information is available over a very large range of spatial scales, and also review some simple interpretations drawn from these results. Next, the optical and X-ray observations will be considered and compared to the radio. Finally, new evidence for motion in the jet, and optical evidence for a counter-jet, are presented.
A. Radio Structure of the Jet
We now examine the morphology seen in total and polarized intensity radio images. We will begin on scales ~ 0.1 pc, working outward to scales ~ 50 kpc. One of the highest resolution images yet obtained of M87 is that of Spencer and Junor (1986; c.f. Baath et al. 1992). This 22 GHz VLBI image, with a resolution of 0.0015" (Figure 2), shows the bright radio core and a weak "jet-like" extension in the west. Perhaps the most important implication of this image is that it sets an upper limit to the size of the region responsible for collimating the jet. If we take the eastern bright point source to be approximately coincident with the central engine, then the initial jet collimation must occur on scales less than or around 1000 A.U.

|
Figure 2. M87 nucleus observed with 22 GHz VLBI at 0.15 mas resolution (shaded circle). Peak brightness is 0.34 Jy beam-1 and the lowest contour is at 0.034 beam-1. North is up. From Spencer and Junor (1986). |
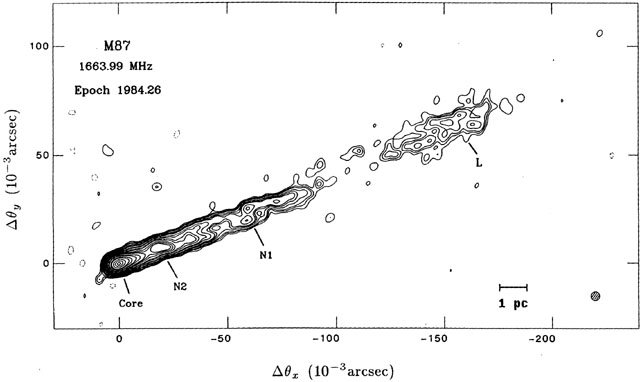
Moving to slightly larger scales, the 18 cm VLBI image of Reid et al. (1989) shows a well collimated jet about 20 pc long emanating from the nucleus (Figure 3). The opening angle of the jet on this scale is 10 degrees (full-width-quarter-maximum), which is only slightly broader than that seen at 1 kpc, indicating that most of the jet collimation has already occurred at this scale ~ 20 pc. The jet also appears to be limb-brightened at several points, due in part to a "filamentary" structure which appears to oscillate from one side of the jet to the other. For example, around 54 mas from the core the jet is brightest at the northern limb; the ridgeline then moves to the southern limb around 60 mas from the core, and then back to the northern limb by about 70 mas from the core.
|
Figure 3. M87 nucleus at 1.66 GHz observed with World Array VLBI. Knots L, N1, and N2 are labeled. The resolution is 4 mas (shaded circle). The brightest region at the nucleus contains 0.97 Jy beam-1 while the lowest contour is at 2 mJy beam-1. North is up. From Reid et al. 1989. |
Similar morphologies are seen on scales to about 1 kpc (12 arcseconds). Figure 4 shows a 15 GHz VLA image of the M87 jet at 0.1" resolution (Owen, Hardee, and Cornwell 1989, hereinafter OHC89). What I will call the "inner jet" - that is, the region from the nucleus to knot A - roughly defines a cone with straight sides and an opening angle of 6 degrees (FWQM). There are many places along the inner jet where the structure is brighter at either or both limbs than in the jet center (i.e. limb-brightened). For example, in knot E, between knots E and F, and again between F and I, the edges of the jet are brighter than the jet center. There are also regions where one limb is particularly bright, such as in knots D and E. Filamentary or long, linear features are also evident in this region. For example, it is possible to follow the brightness ridgeline through knot D along a line which starts at the northern limb near the nucleus, crosses to the southern limb and back near the middle of the knot, and then slowly curves back towards the jet center as we move away from the nucleus. Pieces of similar features are also apparent in knots E and F.

|
Figure 4. M87 jet at 15 GHz with 0.10" resolution. Approximately 40, 6, and 2 hrs. of VLA observation were used in the A, B, and C arrays, respectively. The intensity scale is linear, and white corresponds to 16, 5.5, and 1.8 mJy beam-1 in the top, middle, and bottom panels, respectively. The peak intensity at the nucleus is 2.34 Jy beam-1. The knots are labeled at bottom, and the images are rotated so that up is towards P.A. 21°. Data from Biretta and Owen 1993. |
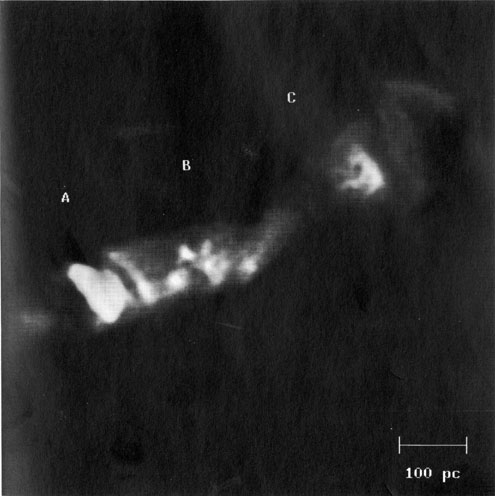
I will refer to the region including knots A, B, and C as the "transition region" of the jet (Figure 5). Here the morphology suddenly changes from a cone with nearly straight walls, to a rough cylinder whose centerline wiggles back and forth, and whose diameter varies. While knot A is well aligned with the inner jet, knot B is displaced slightly south, and knot C slightly to the north. Also, the jet diameter appears to contract slightly between B and C, and then flare somewhat in knot C. This region also contains two remarkable "bright transverse features," which are bright linear regions that stretch across the jet, are oriented roughly normal to the jet axis, and are thin in the direction along the jet. The first is knot A, whose emission is dominated by a linear feature aligned 72 degrees to the jet's axis. The second is within knot C, whose emission is dominated by a feature roughly normal to the local jet axis. Knot B has a more complex, amorphous appearance.
|
Figure 5. Detail of knot A, B, C region of the jet (i.e. "transition region") at 15 GHz with 0.10" resolution. The display intensities have been histogram equalized, and white corresponds roughly to 8 mJy beam-1. North is up. From OHC89. |
Another interesting feature of this region is a narrow dark lane which runs roughly along the centerline of the jet. It is most apparent in the region between knots A and B, and there is perhaps some evidence of it continuing into knot C.
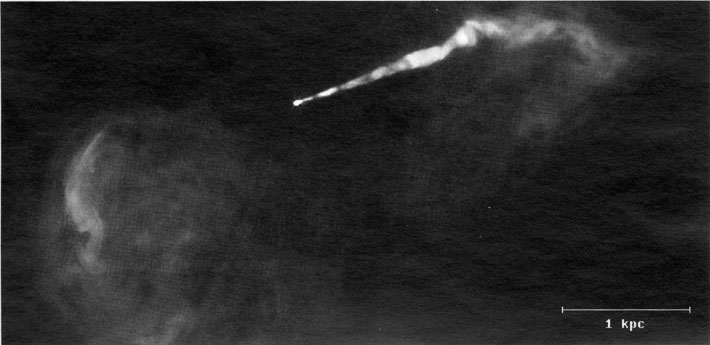
The region beyond knot C is what I shall call the "outer jet." In this region the jet has strong side-to-side oscillations and bends sharply toward the south (Figure 6). After this bend the jet becomes indistinct and merges into the large amorphous lobe region west of the nucleus (Turland 1975). A similar lobe region is seen east of the nucleus, though there is no obvious jet here. Both lobes contain filamentary structures similar to those seen in the jet on mas and arcsecond scales (Hines, Owen, and Eilek 1989). We note that these lobes, while low in surface brightness, completely dominate the source flux at all radio frequencies. There also appears to be an exclusion between these radio lobes and the optical line emitting filaments; the optical line emission is mostly along and just beyond the northern and eastern boundaries of the radio lobe region (Ford and Butcher 1979; Jarvis 1990; Sparks, Ford, and Kinney 1993).
|
Figure 6. High dynamic range image of M87 jet and lobes at 15 GHz. The nucleus is near the center; total extent of the visible source is about 75" or 6 kpc. The resolution is 0.15", and the intensity scale is logarithmic with white corresponding to ~ 5 mJy beam-1. Approximately 40, 6, and 2 hrs. of VLA observation were used in the A, B, and C arrays, respectively. North is up. From Biretta and Owen 1993. |
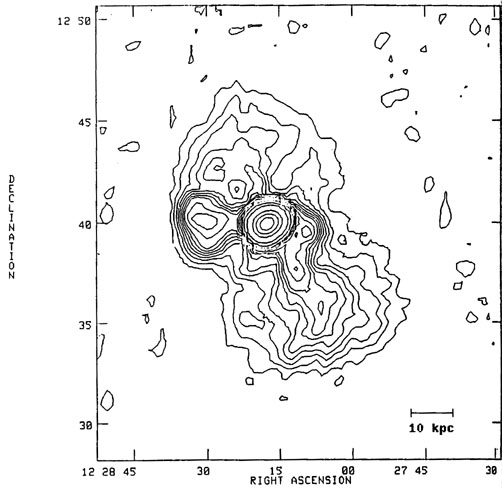
At even larger scales "jet-like" structures again become evident (Figure 7). Here the lobes are only slightly resolved, and irregular, bent structures are seen extending to large distances from the lobe region. On the west side of the source, one of these extends for at least 35 kpc to the southwest, while on the east side another extends to about 19 kpc.
|
Figure 7. Low resolution image of M87 made with at 1.5 GHz with the VLA D configuration. The entire lobe region of Fig. 6 is contained in the bright, nearly unresolved region near the center. Jet-like structures or "plumes" are seen extending ~ 35 kpc towards the south-west and also towards the east. The resolution is ~ 100", and the brightest region has an intensity of 90 Jy beam-1. North is up. From Owen (1992). |
The magnetic field structure of the emission regions may be inferred from polarization images. While there are not yet any VLBI polarization images of the mas-scale jet, the polarization structure of the 20" jet has been studied in detail (OHC89; Fig. 8). The magnetic field runs roughly parallel to the jet everywhere, except in the bright transverse features (knots A and C) where it runs normal to the jet axis and along the transverse features. In general, wherever filamentary, linear, or elongated features are apparent, the field always runs along the length of the feature. Examples of such regions are seen in knots D and E, the brightest region of knot I, the region between knots B and C, the linear feature beyond knot C, and of course, the bright transverse features in knots A and C. This alignment between elongation and magnetic field is also seen in filamentary features of the lobes, the most notable being the bright north-south arc in the eastern lobe 25" from the nucleus (Owen 1992). Fractional polarizations are typically 15 to 30 percent throughout the jet, though some regions show polarizations as high as 50 to 70 percent. These latter values approach the maximum possible for synchrotron emission, and indicate highly ordered magnetic fields. There is also a tendency for fractional polarizations to be higher at the jet edges, especially in knots E, F, and I of the inner jet.

|
Figure 8. Contour plots of jet with vectors showing the local magnetic field direction at 15 GHz. The magnetic field lines are predominantly along the jet, except in knots A and C. A vector length of 1" corresponds to 216% polarization. Contours are space at factors of two in intensity beginning at 1.58 mJy beam-1, and the resolution is ~ 0.15". (a.) Nuclear jet and knots D and E. Point source has been subtracted at nucleus. (b.) Knots E, F, I, and A. (c.) Knots A, B, and C. From OHC89. |
Faraday rotation (the rotation of the polarization direction with increasing wavelength) can be used to measure the product of the electron density and the line-of-sight component of the magnetic field integrated along the line of sight. The Faraday rotation across the jet and lobes has been mapped at 5 GHz with 0.4 arcsecond resolution by Owen, Eilek, and Keel (1990). Rotations toward the jet are typically between -300 and +300 radians m2, while values in the lobes are much larger (+1000 to +2000 radians m-2). This provides some evidence that the jet lies between the lobes and the observer. An otherwise inconspicuous "filament" of high-rotation lies in the east lobe and has typical rotations ~ +6000, with peak values ~ +8500 radians m-2.
I conclude this section with a summary and some implications suggested by the observed morphology. We have seen that the "inner jet" between ~ 0.1 and ~ 1000 pc is quite straight, well collimated, and is often limb-brightened. The magnetic field is predominantly along the jet in this region, and the polarization is often highest at the jet edges. In the "transition region," which is delimited by two bright transverse features in knots A and C, the morphology begins to change. After each transverse feature the jet appears to become less stable, with stronger bends and kinks appearing on the side away from the nucleus. The opening angle of the visible jet is also reduced after each transverse feature; at knot A the diameter of the jet ceases to expand, and in the region beyond knot C the visible jet appears to become much narrower. The magnetic field direction also changes suddenly here, and runs almost normal to the jet in these features. In the "outer jet" region, including the jet beyond knot C, the lobes, and large-scale jet-like structures (1.6 to 40 kpc), the jet appears to have sharp bends and kinks, and is sometimes ill defined. We note that filamentary structures are ubiquitous in the source on all scales, and wherever polarization information is available the magnetic field is seen to run along these filaments.
It is tempting to interpret the straight, narrow inner jet as a high Mach number flow (e.g., Bridle and Perley 1984, Sec. 6.1.4.), followed by shocks at the bright transverse features in knots A and C, and finally subsonic flow in the outer jet region (> 1.5 kpc). Shock waves have been long hypothesized in the M87 jet to provide particle acceleration and thus overcome the "lifetime" problem posed by the optical emission (e.g., Graham 1970; Rees 1978; Blandford and Königl 1979a; c.f. Sec. 3.B.). The morphology of the bright transverse features, and their effect on the overall jet morphology, also suggests the presence of shocks. The bright transverse features might arise where shocks compress and amplify the magnetic fields, thus increasing the synchrotron emissivity (Biretta, Owen, and Hardee 1983). The perpendicular magnetic fields in these features would arise naturally, since only the component of the field in the plane of the shock front is amplified. (Presumably magnetic field of material flowing into the shock would contain some random component to be so amplified.) Furthermore, the increased bending and kinking of the jet after each transverse feature might result from reduction of the jet's Mach number after each shock, thus increasing its susceptibility to Kelvin-Helmholtz instability (Owen, Hardee, and Bignell 1980). The parallel magnetic fields seen for the inner jet might arise from shear in the jet's boundary layer, which would stretch randomly oriented field lines in the direction along the jet (e.g., Begelman, Blandford, and Rees 1984, Sec. II.C.4.). We note that an alternative explanation for the transverse features has been proposed in which they are magnetic filaments wrapped around the surface of the jet (OHC89); however, the jet's reduced stability after knots A and C would still require (invisible) shocks or some additional explanation.