


B. The Radio-to-X-Ray Spectrum of the Jet
In this section I will discuss spectra of the jet, as well as the optical and X-ray morphologies and their comparison to the radio. Figure 9 shows the spectra of the knots between various wavebands (Biretta, Stern, and Harris 1991, hereinafter BSH91). Care must be taken to use similar resolutions and integration regions at the different wavebands; here a resolution of ~ 1.2" is used and the brightness is integrated in contiguous boxes along the jet, with each box containing one knot. Unfortunately a different procedure must be used with the X-ray data, which involves PSF fitting and subtraction, but hopefully this is not a serious problem.
|
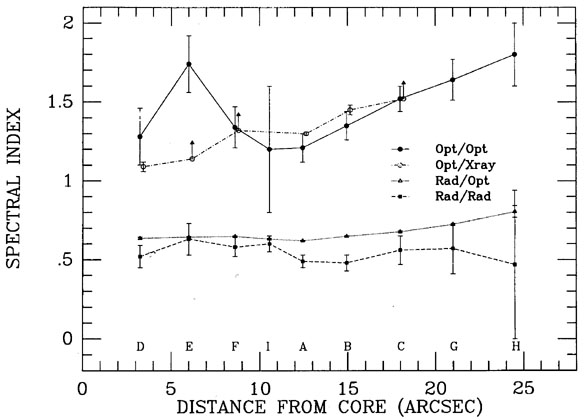
Figure 9. Spectral index of knots in M87
jet between various wavebands vs. distance from nucleus. Spectral index
|
All of the knots are roughly consistent with a radio spectral index
 rr of about
0.5 measured between 1.4 and 15 GHz, where the spectral index is defined
in the sense
S
rr of about
0.5 measured between 1.4 and 15 GHz, where the spectral index is defined
in the sense
S
 -. Large uncertainties near the end of the jet result
from increasing difficulty
in separating the "jet" from the background emission of the western
"lobe" where the
two begin to merge. There are no published results yet at higher
resolution, but some
preliminary work suggests the spectral index is probably slightly
steeper ( ~ 0.6)
between the knots than in the knot centers.
Forster (1980)
finds the spectral index of
the western lobe (jetted lobe) is about 0.65, while the eastern lobe is
steeper at about 0.85.
-. Large uncertainties near the end of the jet result
from increasing difficulty
in separating the "jet" from the background emission of the western
"lobe" where the
two begin to merge. There are no published results yet at higher
resolution, but some
preliminary work suggests the spectral index is probably slightly
steeper ( ~ 0.6)
between the knots than in the knot centers.
Forster (1980)
finds the spectral index of
the western lobe (jetted lobe) is about 0.65, while the eastern lobe is
steeper at about 0.85.
The radio-to-optical spectral indices are well determined, due largely
to the huge
frequency baseline between the radio and optical bands. For the inner
jet (knots D,
E, F, and I) and A the indices are all between
ro = 0.62 and
0.65. After knot A
there is a systematic steepening with increasing distance from the
nucleus, so that between knots B and H
ro steepens from
0.65 to 0.80. It is clear that the
radio-to-optical spectrum is steeper than the radio spectrum, but
whether this is caused by a
gradual change above 15 GHz, or a sudden break near the optical band, is
not known.
Comparison of radio and ground-based optical polarization images show
that both the fractional polarizations, and polarization position
angles, are very similar between these two bands
(Schlötelburg,
Meisenheimer, and Röser 1988;
Fraix-Burnet, Le
Borgne, and Nieto 1989).
This strongly confirms that the optical emission is
synchrotron emission and suggests much of it originates in the same
physical volume as the radio emission.
The above indices are from ground-based optical images, and involve averaging
over a large region encompassing each knot. It is possible to study the
radio-to-optical
spectral index, and the optical morphology, at ~ 0.1" resolution using
the Hubble
Space Telescope. Figure 10 compares two
different deconvolutions of an HST Faint
Object Camera image against a 15 GHz VLA image. This FOC image is a
signal-to-noise
optimized sum of 29 images made through various filters, with the overall
intensity scaled to that at 372 nm wavelength. At first glance the HST
and VLA images are remarkably similar
(Boksenberg et
al. 1992),
though closer examination reveals
a number of differences. The most pervasive difference is that the
optical emission
tends to be concentrated near the center of the jet and in the centers
of the knots
(Sparks, Biretta,
and Macchetto 1993).
This is most apparent for the inner jet (region
encompassing knots D, E, F, and I). One manifestation is that the radio
images show
a low surface brightness component of emission which appears to fill the
width of the
jet, hence defining the jet edges, and also fills much of the regions
between knots. This
emission component appears to be very weak or absent at optical
frequencies. Another
manifestation is that the jet is narrower at optical frequencies than at
radio frequencies.
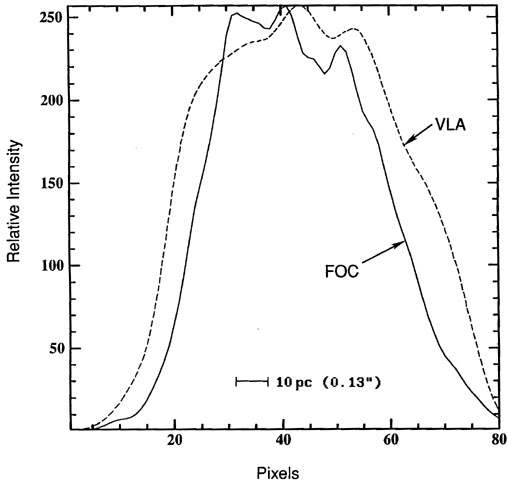
Figure 11 compares the intensity profiles
across knot A and illustrates the narrower
profile for the FOC data; similar differences are seen everywhere in the
jet. Other
differences in details of the structure are also apparent: The optical
emission from knot
E is mostly from a small region near the jet center, whereas the radio
emission is from
a more extended region. There are also striking differences in the
structure between
the nucleus and knot D, though this region is perhaps suspect at both
wavebands due
to deconvolution of the bright nucleus.
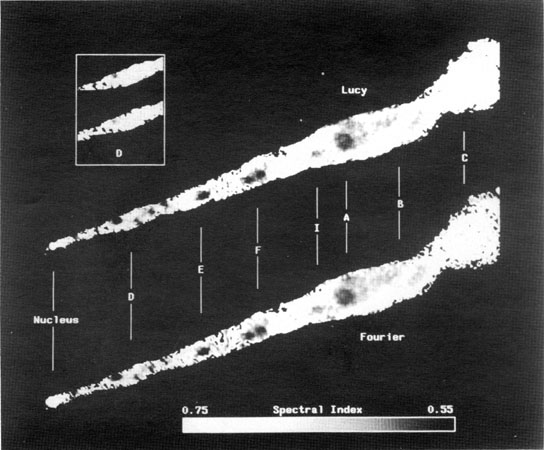
Figure 12 shows the spectral index between
the radio and FOC images, and illustrates many of the effects just
noted. The flattest spectrum is seen in the brightest region of knot D with
ro
0.5. In general the knot
centers have indices ~ 0.6 and the inter-knot regions are steeper at ~
0.7. We note that
the 0.2" long jet in the nucleus
(Fig. 3) has been detected in HST
Planetary Camera
images, and it appears to have a similar spectral index,
ro ~ 0.74
(Lauer et al. 1992).
|
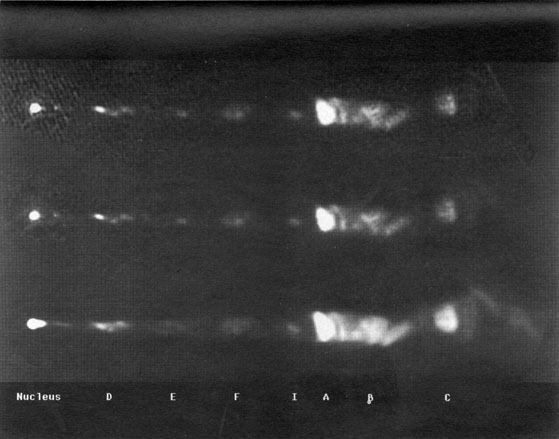
Figure 10. Comparison of optical and radio images of M87 jet at ~ 0.15" resolution. The optical images are composites of 29 HST FOC images scaled to an effective wavelength of 372 nm (806 THz). Both Fourier Quotient (top) and Lucy (middle) deconvolutions are shown. The radio image (bottom) is from 15 GHz VLA data. The images are rotated so that up is toward P.A. 21°. (a.) Low contrast image showing bright structures. Nucleus and knots are labeled along bottom of figure. (b.) High contrast image showing faint features. Original data from Sparks, Biretta, and Macchetto 1993. (Two small circular dark spots in radio image at knot F are photographic artifacts.) |
|
Figure 11. Comparison of radio (VLA 15 GHz) and optical (HST FOC 372 nm) intensity profiles across jet at the position of knot A. The jet appears appreciably narrower in the optical band. The intensities are arbitrarily scaled to give similar profile heights; resolution is ~ 0.10". The horizontal scale is in FOC pixels, with 1 pixel = 0.022". |
Spectral indices within the optical band are more difficult to
determine, and there
is some controversy in this area. The short frequency baseline will
exacerbate any small
systematic errors, and differences in seeing and integration areas may
also affect the
results. For example, values of the optical spectral index of knot A,
the brightest knot,
range from oo ~
0.57±0.05
(Keel 1988)
to 1.21±0.09
(BSH91).
Recently there appears
to be some consensus developing for a value roughly between 0.9 and 1.0
(Perez-Fournon et
al. 1988;
Meisenheimer 1991;
Zeilinger,
Möller, and Stiavelli 1993).
In any case, it
appears fairly clear that the spectrum is appreciably steeper within the
optical band
than between the radio and optical. There is also agreement among
different authors
that knots of the inner jet have similar spectra, but that there is a
systematic steepening
after knot A which reaches
 ~ 0.5 around knot G.
Meisenheimer (1991)
reports evidence for steeper optical spectral indices between the knots
by about
~ 0.1
as compared to the knot centers. Infrared and ultraviolet data
(Stocke et al. 1981;
Smith et al. 1983;
Killeen et al. 1984;
Perola and Tarenghi
1980;
Sparks, Biretta,
and Macchetto 1993)
seem consistent with simple power-law interpolations
between the radio, optical, and X-ray bands, provided corrections are made for
differing aperture
sizes (BSH91).
~ 0.5 around knot G.
Meisenheimer (1991)
reports evidence for steeper optical spectral indices between the knots
by about
~ 0.1
as compared to the knot centers. Infrared and ultraviolet data
(Stocke et al. 1981;
Smith et al. 1983;
Killeen et al. 1984;
Perola and Tarenghi
1980;
Sparks, Biretta,
and Macchetto 1993)
seem consistent with simple power-law interpolations
between the radio, optical, and X-ray bands, provided corrections are made for
differing aperture
sizes (BSH91).
|
Figure 12. Radio to optical spectral index
map at ~ 0.15"
resolution using data from Fig. 10. The top
image uses a Lucy
deconvolution of the HST data, while the bottom image uses a Fourier
Quotient deconvolution Spectral index runs from
|
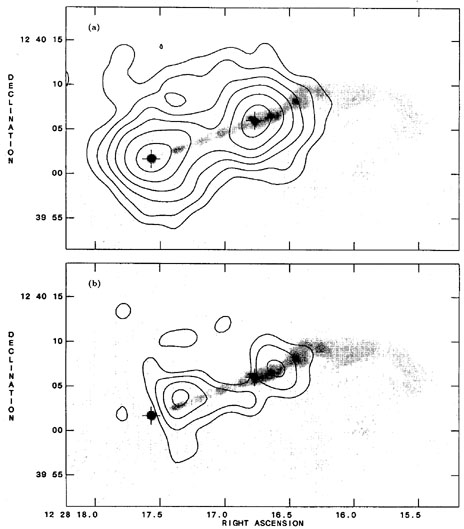
Einstein X-ray images with 3" resolution show two emission components
(Schreier,
Gorenstein, and Fiegelson 1982),
and if the eastern one is aligned with
the nucleus, we
find that the western component aligns precisely with knot A
(Figure 13). Subtracting
these two dominant components reveals fainter emission at the positions
of knots D
and B (BSH91).
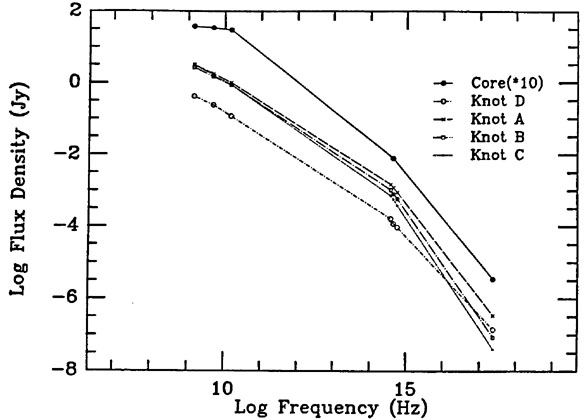
Knot D has the flattest optical-to-X-ray spectral index
of 1.08 ± 0.03. Knot A is steeper at
ox = 1.30 ±
0.01, and B and C are
steeper yet (Figure 9). The
overall radio-to-X-ray spectrum is shown by
Figure 14. The emission process for the
X-rays is not entirely clear. Some support for synchrotron emission is
provided by the
consistency between the extrapolated optical spectrum and the observed
X-ray flux, and by the trend for
ox to steepen
systematically between
knots A, B, and C as seen
for ro and
oo, but these are
circumstantial evidences at best.
|
Figure 13. Comparison of radio (grey scale) and X-ray (contour plot) images of jet. The images have been aligned at the bright eastern component, which is assumed to be the nucleus in the X-ray image. (a.) X-ray image showing dominant emission components at nucleus and knot A. (b.) X-ray image with point sources subtracted at the positions of the nucleus and knot A (crosses). Weak emission is evident from knots D and B. From BSH91. |
|
Figure 14. Radio to X-ray spectra of core and brightest knots in jet. While the spectra are generally similar, there is a trend for them to steepen with distance from the nucleus - knot D has the flattest spectrum, and knot C has the steepest. From BSH91. |
We noted in Section B that there were systematic differences between the
morphologies
of the inner jet and the rest of the jet. Differences are also apparent
in the spectra,
and can be highlighted by constructing a Hertzsprung-Russell diagram for
knots in the
jet (Figure 15). Apparently knots of the inner
jet all have similar
ro and brightness,
while the transition region and outer
jet define a sequence of decreasing brightness and steepening spectra.

|
Figure 15. Hertsprung-Russell style diagram for knots in jet. The vertical axis shows radio (5 GHz) to optical (i band) spectral index, while the horizontal axis is radio peak brightness (Jy beam-1 at 5 GHz). The dashed line connects the knots in order of distance from the nucleus. Knots D, E, F, and I ("inner jet") occupy a small region, while knots A, B, C, G, and H define a sequence of steepening spectra and decreasing brightness. Knots of the inner jet (D, F, and I) have spectra similar to knot A, but are much fainter. |
To summarize this section, we have seen that the optical and X-ray morphologies
of the jet are remarkably similar to the radio. Throughout the jet the
radio spectral index is ~ 0.5. The inner jet has
ro ~ 0.65 and
oo ~ 1.2, and the
optical emission tends to concentrate in the knot centers. Knots A, B, and C
("transition" region) show
steepening ro,
oo, and
ox with
increasing distance from the nucleus, and edges of
the jet are optically weak. Beyond knot C ("outer jet") there is very
little optical or X-ray emission.