


3.5. Density and velocity dispersion profiles
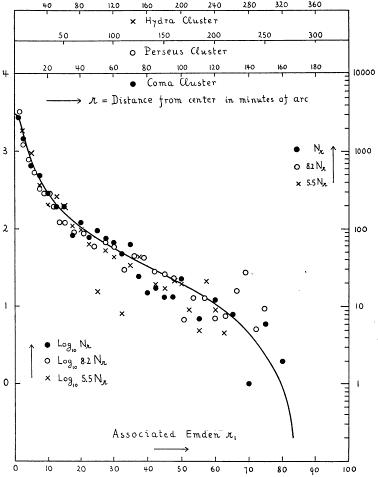
It was Zwicky [516], in 1942, the first to propose an analytical form for the spatial distribution of galaxies in clusters, i.e. Emden's model for a bounded isothermal gas sphere - see Fig. 14. In 1954, Shane & Wirtanen [412] found that the surface brightness profile of galaxy clusters could also be fitted with the distribution function proposed by de Vaucouleurs [127] as a fit to the surface brightness profile of elliptical galaxies. As a matter of fact, the similarity of the profiles of ellipticals and the Coma cluster had already been noted by Zwicky [513] in 1937. In 1962 Abell [12] pointed out that equally good fits could be obtained using distribution formulæ different from Emden's. The fact that Emden's model fit the data well could not be taken as evidence that clusters are isothermal spheres. One year later, as to support Abell's conclusions, King [254] published his empirical density law for star clusters which proved very successful in describing cluster density profiles as well.
|
Figure 14. The number of nebulæ per square degree vs. the distance from the cluster centre and the best fit Emden model (solid line). From Zwicky (1942b). |
One of the assumptions of all these models, spherical symmetry, was called into question when Matthews et al. [295] and Sastry [400] noted that the major axis of the central giant galaxy was aligned with the galaxy distribution in cD clusters, thus anticipating the results of Carter & Metcalfe [97] and Binggeli [62]. Moreover, The NE-SW elongation of the Coma cluster was remarked upon by Bahcall [40], Schipper & King [403], and Thompson & Gregory [454]. Things complicated even further when Sharov [419], Omer et al. [335], and Clark [110] found evidence for secondary peaks in the density profiles of several clusters. Their findings were later confirmed by Oemler [331]. In 1978 Dressler [140] proposed subclustering as an explanation for irregularities in the density profiles.
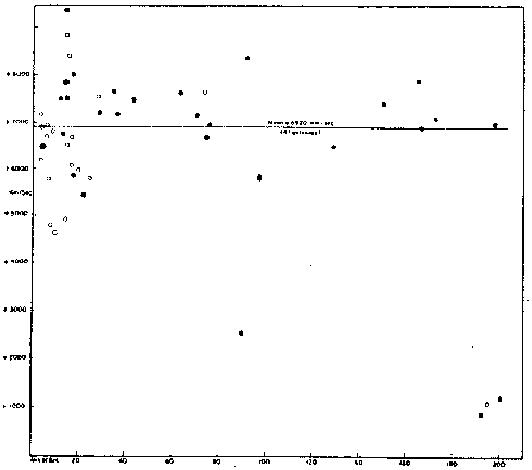
Another assumption of Zwicky's model was isothermality, an hypothesis supported by an early plot of the Virgo galaxy velocities vs. clustercentric distances (Smith [425]). The validity of Zwicky's assumption was shattered in 1960 by Mayall [297]'s diagram of velocities vs. radii for 50 galaxies in the Coma cluster. In this diagram - here reproduced in Fig. 15 - one could clearly see a decrease of the velocity dispersion with radius. A similar trend was later found by Karachentsev [247] for the Virgo cluster. On the other hand, Zwicky & Humason [529] found a flat velocity dispersion profile in Abell 194.
|
Figure 15. The velocities of galaxies in the Coma region vs. clustercentric distances. The distances range from 0 to 200', the velocities from 0 to 9000 km/s. From Mayall (1960). |
In 1971 Chincarini & Rood [107] showed the Perseus cluster to have a decreasing velocity dispersion profile, and one year later Rood et al. [385] confirmed Mayall [297]'s early suggestion that the Coma cluster velocity dispersion profile is a decreasing function of the clustercentric distance. These early measurements of the Perseus and Coma velocity dispersion profile, were later refined by Kent & Sargent [253] and, respectively, Kent & Gunn [252], who confirmed deviation from isothermality. The velocity dispersion profiles of galaxy clusters were classified into four different types by Struble [437]. He showed that isothermal profiles are not a common feature of all clusters.
Density and velocity dispersion profiles have now been obtained for the different galaxy populations [22, 73]. Velocity dispersion profiles are certainly not isothermal, and are different for different galaxy populations [73], so that the global velocity dispersion profile of a cluster changes according to its galaxy morphological mix. So far, no analytical model has been proposed for the cluster velocity dispersion profile. Recently Navarro et al. [318] have proposed a new analytical model for the cluster density profiles, which is now extremely popular. Consistency has been found between this new model and the data, but, once more, other models provide equally good fits to the data [93].