


3.6. The hot IC gas
It was Limber
[280]
in 1959 the first to suggest that diffuse
gas must be present among galaxies, and clusters be filled with a hot
IC diffuse gas component. He argued that galaxy formation from gas
cannot be 100 % efficient, and some gas must be lost from galaxies
through collisions. The first detection of an X-ray source associated
with a cluster of galaxies came from Byram et al.
[88], in
1966. They detected M 87, the central giant galaxy of the Virgo cluster. In the same year, Boldt et al.
[75]
claimed detection
of the Coma cluster in X-ray. It took just one year to
Friedman &
Byram [170]
to show that Boldt et al.'s detection was spurious.
However, Boldt et al.'s spurious result inspired Felten et
al. [162]'s
correct theoretical estimate. Felten et
al. estimated that a thermalized diffuse gas in the Coma cluster
should have a temperature
 7 × 10⁷ K, and would
therefore emit in the X-ray via thermal bremsstrahlung.
7 × 10⁷ K, and would
therefore emit in the X-ray via thermal bremsstrahlung.
In 1971, Cavaliere et al. [100] suggested that many extragalactic X-ray sources are probably associated with clusters of galaxies. The same year, the extended X-ray emission from the Coma IC gas was detected, by Meekins et al. [299], with observations from an Aerobee 150 rocket, and, independently, by Gursky et al. [201], with the Uhuru satellite. Thanks to Uhuru many more clusters were X-ray detected, and as early as in 1972, Gursky et al. [202] suggested that
``most, if not all, rich clusters include an X-ray emission region of large size and of net luminosity 1043-1044 erg s-1''
A first indication about the nature of the diffuse cluster X-ray emission came from Solinger & Tucker [427] in 1972, with an early indication of a correlation between the X-ray luminosities of clusters and the velocity dispersions of their member galaxies. Such a correlation is naturally expected if the gas is thermalized, in equilibrium with the cluster gravitational potential, and the emission mechanism is thermal bremsstrahlung. This correlation was later improved by Cooke & Maccagni [111].
Always in 1972, Syunyaev & Zel'dovich
[442]
proposed The
observation of relic radiation as a test of the nature of X-ray
radiation from the clusters of galaxies. Immediately after, an
over-enthusiast Parijsky
[347]
gave a start to a series of
spurious detections of the Syunyaev-Zel'dovich effect. Other
early controversial detections were claimed by Gull &
Northover [198],
Lake &
Partridge [265,
266], Birkinshaw
et al. [65,
64],
all regarded with much scepticism by
theorists (Gould & Rephaeli
[193], Tarter
[450]). White
& Silk
[497]
noted that the combined X-ray and microwave
observations of Abell 576 would have implied an improbable value for
the Hubble constant of 1.5 km
s-1 Mpc-1!
There has been an impressive observational progress in this field over the last decade. Nowadays, the rate of reliable Syunyaev-Zel'dovich detections of clusters is very high, and techniques allow Syunyaev-Zel'dovich imaging of galaxy clusters (see CARLSTROM, these proceedings).
In 1973, Lea et al.
[276]
analysed the distribution of the IC
gas and showed the gas to be less centrally concentrated than
galaxies. Their model of the IC gas distribution was the first of a
long series [272,
197,
48],
among which the  -model of
Cavaliere & Fusco-Femiano
[98,
99]
proved the most successful. Lea et al.
[276]'s
result was confirmed by
Bahcall [41],
and by Gorenstein et al.
[186], who
estimated the slope of the galaxy number density profile in Coma to be
twice the slope of the gas density profile. Bahcall
[41] also
showed that the peak of the diffuse X-ray emission coincides with the
centre of the galaxy distribution, or with the position of the cD
galaxy.
-model of
Cavaliere & Fusco-Femiano
[98,
99]
proved the most successful. Lea et al.
[276]'s
result was confirmed by
Bahcall [41],
and by Gorenstein et al.
[186], who
estimated the slope of the galaxy number density profile in Coma to be
twice the slope of the gas density profile. Bahcall
[41] also
showed that the peak of the diffuse X-ray emission coincides with the
centre of the galaxy distribution, or with the position of the cD
galaxy.
Bahcall [41] started a systematic comparison of optical and X-ray cluster properties. She found richer clusters to be more likely associated with X-ray sources, and cD-type clusters to have higher X-ray luminosities. On the other hand, she confirmed Kellogg et al. [250]'s result that clusters of a given richness class span a wide range of X-ray luminosities. Later, she found a relation between the fraction of spirals in clusters and the X-ray luminosity [42].
|
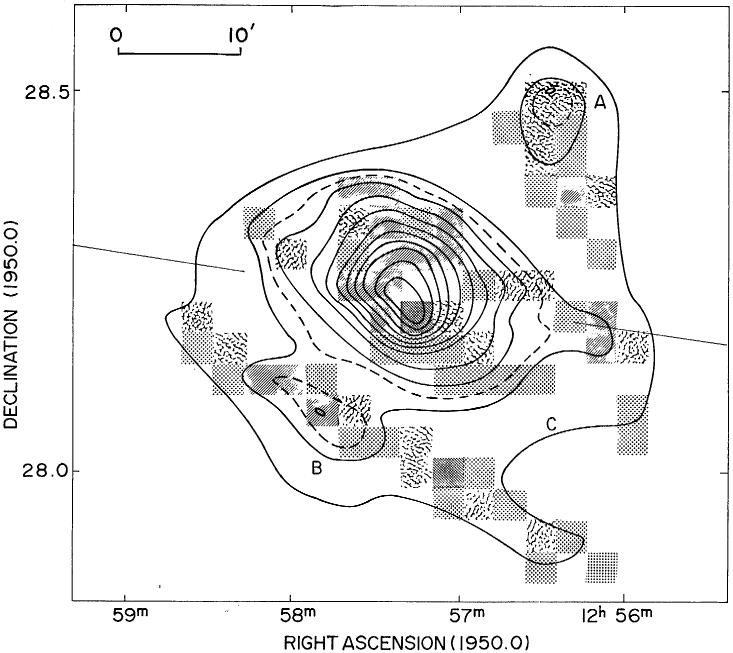
Figure 16. The Coma cluster X-ray brightness distribution, according to two different reconstruction algorithms (contours and boxes). The straight line is the major axis of the galaxy luminosity distribution. From Johnson et al. (1979). |
Wolff et al. [503] were possibly the first to record a deviation of the X-ray surface brightness distribution from spherical symmetry. They showed the X-ray emission of Perseus to be elongated along the E-W direction, like the galaxy distribution. Some years later, in 1979, Gorenstein et al. [186], and Johnson et al. [243] found a good correspondence between the shape of the X-ray emission and the galaxy distribution in Coma - see Fig. 16. The Einstein IPC observations of Jones et al. [244] finally revealed all the complex cluster X-ray morphologies. The close correspondence between the X-ray emission and the galaxy distribution was interpreted by Gioia et al. [179] as evidence for equilibrium of both the IC gas and the cluster galaxies in the cluster gravitational potential.
|
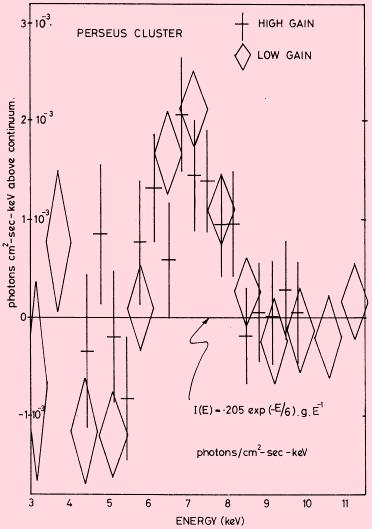
Figure 17. The deviation of the flux as a function of energy from the flux predicted by the best fitting single temperature continuum in the Perseus cluster. The Iron line feature is evident at around 7 keV. From Mitchell et al. (1976). |
The thermal bremsstrahlung interpretation received further support by
the lack of detection of hard (>20 keV) X-ray emission from Coma and
Perseus by Scheepmaker et al.
[401]'s
balloon-borne X-ray
experiment. The thermal origin of the X-ray emission was finally
demonstrated in 1976 and 1977, with the Ariel V detection of the 7 keV
Iron line in Perseus and Centaurus by Mitchell et al.
[309] and
Mitchell & Culhane
[308]
(see Fig. 17), and with
the analogous OSO 8 detections in Virgo, Perseus and Coma, by
Serlemitsos et al.
[410].
In 1977, 30 clusters had been
identified as X-ray sources, 10 of them with extended
emission [116].
Mitchell et al.
[310]
and Mushotzky et
al. [315]
produced the first relations between the X-ray
temperatures and velocity dispersions of eight, and, respectively, 13
clusters. With much scatter, these relations looked however consistent
with TX 
 v2
(where TX is the X-ray temperature
and v
the galaxy velocity dispersion), as expected if the
X-ray emission was produced by an IC gas in equilibrium with the
gravitational potential traced by cluster galaxies.
v2
(where TX is the X-ray temperature
and v
the galaxy velocity dispersion), as expected if the
X-ray emission was produced by an IC gas in equilibrium with the
gravitational potential traced by cluster galaxies.
In 1980, Schwartz et al. [404, 405] detected X-ray emission from poor clusters and compact groups, at temperatures consistent with the low velocity dispersions of their member galaxies. The nature of the X-ray emission from poor galaxy systems is still debated. Both the contribution of individual galaxies to the total emission and Supernova heating must be considered (see PONMAN, these proceedings).