


4.4. The Large Scale Distribution of Dark Matter
Observational determinations of the large scale distribution of
dark matter make use of the peculiar velocity formulation
discussed in Chapter 3. For the local case
of Virgocentric
flow, the infall velocity and the position of the Local group
is driven by two competing sources of acceleration. On the one
hand, the gravitational acceleration is driven by the amount of
mass overdensity 
 /
in the
Virgo cluster. On the
other hand, this mass overdensity must compete against the
average mass density of the Universe (e.g.,
/
in the
Virgo cluster. On the
other hand, this mass overdensity must compete against the
average mass density of the Universe (e.g.,
 ).
).
As a case in point, let's now consider the infall of the Local Group
towards Virgo. We assume
a cosmic velocity of 1500 km s-1 for Virgo and a LG infall
velocity of 250 km s-1.
The observed value in light of /
is
 2 (Bushouse et al.
1985; Tully and Shaya 1984; Tonry and Davis 1981).
For = 1, application of
equation 3.39 yields
2 (Bushouse et al.
1985; Tully and Shaya 1984; Tonry and Davis 1981).
For = 1, application of
equation 3.39 yields
| (21a) |
which is solved with /
0.6. This is
significantly less than the observed value and readily implies
that the distribution of light is more strongly clustered than the
distribution of mass on this scale of
1500 km s-1.
In an = 0.1 Universe we have
| (21b) |
which is solved with /
3.0. This density
contrast is closer to the observed value in light
( /
2.0)
and requires little or no biasing.
This simple model shows the degeneracy between the biasing factor and
the value of inferred from
peculiar velocity data.
While ideally the peculiar velocity field is a direct
reflection of the large scale density field, the presence of possible
bias between the mass and light distributions is a complicating factor.
In practice it is only the first order component

|
which can be recovered from the data. Clearly, the best
thing to do is to select a sample in which b
1. This is
difficult to do a priori but there has been significant effort
along these lines.
The most robust attempt is the POTENT effort (see Bertschinger et al. 1990; Dekel et al. 1993) in which the large scale density field as defined in redshift surveys is used to predict the peculiar velocity field. This is a purely local approach where peculiar velocities in one area of the sky are used to generate the local density maxima (or minima). This builds up a topological map of the dark matter distribution which can be compared to the topology based on a redshift survey when it is smoothed to the scale of the peculiar velocities.
The redshift sample that seems most suited for this purpose is that
of a flux limited sample of IRAS galaxies (Strauss et al. 1992). IRAS
galaxies are generally star forming spirals that are located in regions
of modest to low galaxy density.
The linchpin of this analysis is the explicit assumption
that peculiar velocities are generated locally. Thus, a galaxy near
a mass concentration such as the GA or the Coma cluster feels only
that cluster. The LP result clearly calls this assumption
into question as the scale over which peculiar velocities of individual
galaxies is unclear. Thus, while the POTENT method when applied to
the IRAS redshift sample does return a value of
0 = 1, it
remains unclear if a fair volume has been sampled.
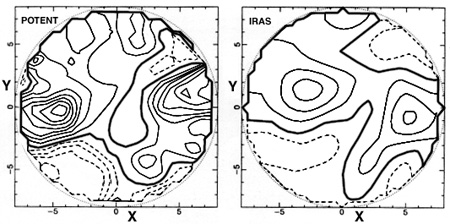
Figure 4-6 shows the comparison between the density distribution as inferred from POTENT compared to that from the IRAS galaxy redshift survey. The qualitative agreement is good as both maps clearly reveal the Perseus-Pisces, Coma and Hydra-Centaurus regions which are the three nearest high density regions. It is, however, interesting to speculate that if large scale variations in dark matter densities exist, then galaxies located near the peaks of that distribution may have more dark matter phased mixed into their potentials than galaxies located near the valleys. This could introduce systematic error in the determination of relative distances and may be the source of systematic error in the LP result. We discuss this possibility a bit further in Chapter 5.
|
|

|
Figure 4-6: Comparison of density distributions inferred from the POTENT method to that obtained directly from a redshift survey of IRAS galaxies. Top panel shows the density distribution represented by contours. This figure has been adapted from Dekel 1994 (and also Strauss and Willick 1995). The heavy contour marks the boundary of the comparison volume of effective radius 46 Mpc/h The bottom panels show the contour view edge-on where the height in the surface plot is proportional to the density contrast. This figure comes courtesy of A. Dekel and will appear in Sigad etal 1997. In both cases the data have both smoothed with a Gaussian window of radius 12 Mpc/h . While the POTENT density field is more strongly peaked than the density field inferred from the IRAS data, the two representations are qualitiatively similar in that two principal density maxima in the Local Universe clearly stand out. These are associated with the Hydra-Cen and the Perseus-Pisces superclusters. |
A lengthy but excellent review of
the comparison between peculiar velocity data and gravitational
instability plus CDM theory is offered by Strauss and Willick (1995).
Their summary clearly shows that various attempts to measure
 through some 20 different methods, yield a range of values from 0.45
to 1.28, with no clearly preferred method dominating the measurements.
Moreover, constraints on from
peculiar velocity data seem to
depend on scale (and choice of sample). For the simplest local system,
the infall of the Local Group to the Virgo cluster, although the infall
velocity is uncertain, low values of
(e.g., 0.2-0.3) are
supported. On larger scales, all-sky samples such as the IRAS galaxy sample
of Fisher et al. (1994), when smoothed with a 1200 km s-1
Gaussian, favors
= 1.
through some 20 different methods, yield a range of values from 0.45
to 1.28, with no clearly preferred method dominating the measurements.
Moreover, constraints on from
peculiar velocity data seem to
depend on scale (and choice of sample). For the simplest local system,
the infall of the Local Group to the Virgo cluster, although the infall
velocity is uncertain, low values of
(e.g., 0.2-0.3) are
supported. On larger scales, all-sky samples such as the IRAS galaxy sample
of Fisher et al. (1994), when smoothed with a 1200 km s-1
Gaussian, favors
= 1.
From the observational point of view there are no strong constraints on
. While the bulk of the data
prefer values of
 0.3, a highly dark matter dominated Universe (e.g.,
=1) can not
be entirely ruled out. This leads to a physical divergence of
cosmological models. On the one hand, the Universe might actually
be relatively simple having most or all of its mass in conventional
form (e.g., baryons). On the other hand, the Universe might be dominated
by some exotic form of matter that we have not detected yet. Since
its the mass distribution which determines the overall geometry of
spacetime and hence our cosmological model, the solution of the
dark matter problem clearly has far reaching implications. As we
will now investigate in detail, there are strong and compelling
theoretical reasons to believe that
= 1 and that dark matter
dominates the large scale behavior of the Universe.
0.3, a highly dark matter dominated Universe (e.g.,
=1) can not
be entirely ruled out. This leads to a physical divergence of
cosmological models. On the one hand, the Universe might actually
be relatively simple having most or all of its mass in conventional
form (e.g., baryons). On the other hand, the Universe might be dominated
by some exotic form of matter that we have not detected yet. Since
its the mass distribution which determines the overall geometry of
spacetime and hence our cosmological model, the solution of the
dark matter problem clearly has far reaching implications. As we
will now investigate in detail, there are strong and compelling
theoretical reasons to believe that
= 1 and that dark matter
dominates the large scale behavior of the Universe.