


The history of quasar absorption lines began within a couple of
years of the identification of the first quasar in 1963.
In 1965, Gunn and Peterson considered the detection of flux
blueward of the Ly emission
line in the quasar
3C 9, observed by Schmidt, and derived a limit on the
amount of neutral Hydrogen that could be present in intergalactic space.
In that same year, Bahcall and Salpeter predicted
that intervening material should produce observable discrete
absorption features in quasar spectra.
Such features were detected in 1967 in the quasar PKS 0237-23 by
Greenstein and Schmidt, and in 1968 in PHL 938 by Burbidge,
Lynds, and Stockton.
By 1969 many intervening systems had been discovered, and
Bahcall and Spitzer proposed that most with metals were produced
by the halos of normal galaxies.
As more data accumulated, the sheer number of
Ly forest
lines strongly supported the idea that galactic and intergalactic
gas, and not only material intrinsic to the quasar, is the
source of most quasar absorption lines.
emission
line in the quasar
3C 9, observed by Schmidt, and derived a limit on the
amount of neutral Hydrogen that could be present in intergalactic space.
In that same year, Bahcall and Salpeter predicted
that intervening material should produce observable discrete
absorption features in quasar spectra.
Such features were detected in 1967 in the quasar PKS 0237-23 by
Greenstein and Schmidt, and in 1968 in PHL 938 by Burbidge,
Lynds, and Stockton.
By 1969 many intervening systems had been discovered, and
Bahcall and Spitzer proposed that most with metals were produced
by the halos of normal galaxies.
As more data accumulated, the sheer number of
Ly forest
lines strongly supported the idea that galactic and intergalactic
gas, and not only material intrinsic to the quasar, is the
source of most quasar absorption lines.
In the 1980's many more quasar spectra were obtained and
many large statistical surveys of the different classes of
absorption line systems were published.
The emphasis was to characterize the number of lines per unit
redshift, dN/dz, stronger than some specified equivalent width
limit. With 4m-class telescopes [equipped with charge coupled device
(CCD) detectors] it was possible to conduct surveys with a
spectral resolution of R ~ 1000.
The spectral resolution is defined as
R =  /
/
 = c /
v, so that R = 1000
corresponds to 300 km s-1 or 5 Å at
= 5000 Å.
Separate surveys were conducted for
Ly lines, Mg II doublets,
C IV doublets, and also for Lyman limit breaks, all as
a function of redshift.
The Ly line is observable in
the optical part of the
spectrum for z > 2.2, Mg II for 0.4 < z < 2.2, C IV for
1.7 < z < 5.0, and the Lyman limit break for z > 3.
However, a break is also easily identified in lower resolution
space-based UV spectra, which extended Lyman limit surveys to
lower redshift.
= c /
v, so that R = 1000
corresponds to 300 km s-1 or 5 Å at
= 5000 Å.
Separate surveys were conducted for
Ly lines, Mg II doublets,
C IV doublets, and also for Lyman limit breaks, all as
a function of redshift.
The Ly line is observable in
the optical part of the
spectrum for z > 2.2, Mg II for 0.4 < z < 2.2, C IV for
1.7 < z < 5.0, and the Lyman limit break for z > 3.
However, a break is also easily identified in lower resolution
space-based UV spectra, which extended Lyman limit surveys to
lower redshift.
In order to consider the cross section of the sky covered
by the different populations, it can be assumed that absorption
will be observed for all lines of sight within some radius of
every luminous galaxy (> 0.05
L*K). (L*K represents
the Schechter luminosity, i.e. the transition between the
exponential and the power law forms of the luminosity function,
and corresponds to a K-band absolute magnitude of
MK = -25).
To explain the observed dN/dz at z ~ 1.5, this radius would be
70 kpc for strong C IV (detection sensitivity 0.4 Å),
and 40 kpc for strong Mg II (detection sensitivity 0.3 Å)
and also for Lyman limit systems, implying that the latter two
populations are in fact produced in the same gas.
The higher N(HI) damped Ly
absorbers would be
produced within 15 kpc of the center of each galaxy, while
the Ly forest lines would
require a considerably
larger region, hundreds of kpcs around each galaxy to produce
a cross section consistent with the observed number of weak lines.
Up until the 1990's, the focus of quasar absorption line
work was to separately consider the properties of the individual
classes of absorbers (eg.
Ly forest or Mg II absorbers).
In the 1990's, however, three different observational advances
led to recognition of the direct connections between the different
classes of quasar absorption lines, and of direct associations
with the population of galaxies:
1. Deep images of quasar fields could be obtained, and redshifts of the galaxies in the field could be determined from low resolution spectra. Steidel found that whenever Mg II absorption with Wr(Mg II) > 0.3 Å is observed, a luminous galaxy (LK > 0.06 L*K) is found within an impact parameter of 38 h-1 (L/L*K)-0.15 kpc with a redshift coincident with that determined from the absorption lines. Also, it is rare to find a galaxy within this impact parameter that does not produce Mg II absorption. There appears to be a one-to-one correspondence between strong Mg II absorption and luminous galaxies. The Mg II absorbing galaxies span a range of morphological types.
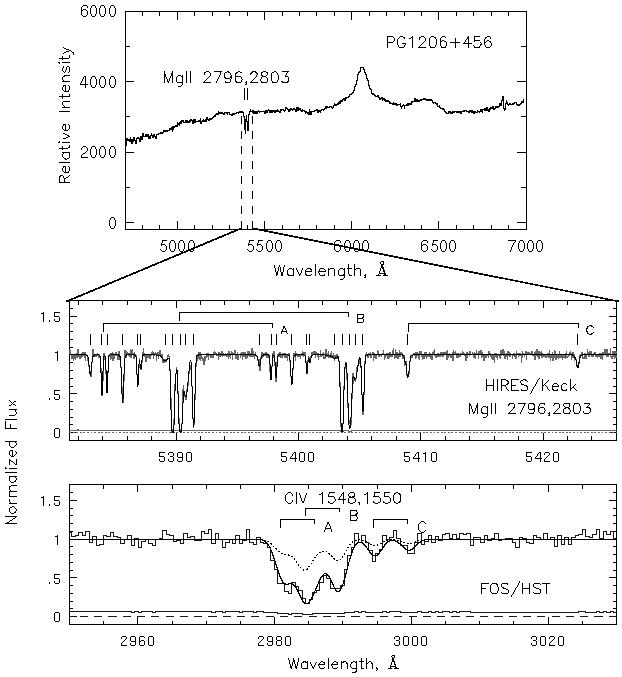
2. The High Resolution Spectrograph on the Keck I 10-meter telescope made it possible to obtain quasar spectra at a resolution of R = 45,000, which corresponds to ~ 6 km s-1. The previous surveys with resolution of order hundreds of km s-1 identified absorption due to entire galaxies and their environments. With 6 km s-1 resolution it became possible to resolve structure within a galaxy: the clouds in its halo, the interstellar medium of its disk, and the satellites and infalling gas clouds in its environment. Figure 4 is a dramatic illustration of this contrast for the Mg II absorber at z = 0.93 toward the quasar PG 1206+459.
|
Figure 4. Dramatic demonstration of gains
due to high resolution
spectroscopy of the Mg II doublet. The top panel is a R = 3000
spectrum of PG 1206+459. The doublet that is apparent at
an observed wavelength of ~ 5400 Å is due to Mg II
absorption from a system at z = 0.927. The middle panel shows
the remarkable kinematic structure that is revealed at the
resolution (R = 45,000) of the Keck/HIRES spectrograph of
the same quasar. The 2796 Å
transition is resolved into multiple components (5583-5592 Å),
which also appear in the 2803 Å
transition (5396-5406 Å). This system can be separated
in two ``clusters'' of clouds, labeled ``A'' and ``B''.
Another weaker Mg II doublet is observed at 5409 and
5423 Å, from a system at z = 0.934 Å, labeled with a ``C''.
The solid line through these complex Mg II profiles is the
result of multiple Voigt profile fitting, with a cloud centered
on each of the ticks drawn above the spectrum.
The lower panel shows the C IV doublets associated
with the same three systems, observed with the Faint Object
Spectrograph on HST, but at much lower resolution (R = 1300).
The C IV is in three different concentrations around the
three systems ``A'', ``B'', and ``C''. The
C IV |
3. The Faint Object Spectrograph (FOS)
on the Hubble Space Telescope provided resolution R ~ 1000
in the UV, from 1400-3300 Å.
Observations of Ly forest
clouds could be extended from
z = 2.2 down to the present epoch.
Furthermore, absorption from a given galaxy could be observed in
numerous transitions; if Mg II was observed in the optical,
the Lyman series and C IV could be studied in the UV
(see Figure 4).
With information on transitions with a range of ionization
states, consideration of the degree of ionization (related
to the gas density and the intensity and shape of the
ionizing radiation field) and the multiple phase structure
of galactic gas became possible.
No longer is analysis of absorption lines in quasar spectra
an esoteric subject. It has developed into a powerful tool to
be used in the study of galaxy evolution (eg. similar to
imaging the stellar components of the galaxies).
At least in principle, quasar spectra can be used for an
unbiased study of the gaseous environments of galaxies from
the present back to the highest redshifts at which quasars
are observed. Gas structures smaller than 1
M can be
detected if they are intercepted by the quasar line of sight, irrespective of
whether they emit light.
Through the tool of quasar absorption lines, proto-galactic
structures and low surface brightness galaxies can be studied
as well as high luminosity galaxies.
can be
detected if they are intercepted by the quasar line of sight, irrespective of
whether they emit light.
Through the tool of quasar absorption lines, proto-galactic
structures and low surface brightness galaxies can be studied
as well as high luminosity galaxies.