


4.2. Source Counts
To predict the number of sources that will become available
with the future sensitivity, let us adopt a simple model of
starburst formation, in the frame of the hierarchical theory
of galaxy formation. The cosmology adopted here is
an Einstein-de Sitter model,  =
1, with no
cosmological constant, and H0 = 75 km/s/Mpc,
q0 = 0.5.The number of mergers as a function
of redshifts can be easily computed through the Press-Schechter formalism
(Press &
Schechter 1974),
assuming self-similarity for the probability of dark halos merging
(i.e. independent of mass,
Blain & Longair
1993):
the mass spectrum of bound objects is, at any redshift z:
=
1, with no
cosmological constant, and H0 = 75 km/s/Mpc,
q0 = 0.5.The number of mergers as a function
of redshifts can be easily computed through the Press-Schechter formalism
(Press &
Schechter 1974),
assuming self-similarity for the probability of dark halos merging
(i.e. independent of mass,
Blain & Longair
1993):
the mass spectrum of bound objects is, at any redshift z:
|
where  = (3 +
n) / 3, and n the power-law slope of the
primordial fluctuations (n = -1 here, so that
= 2/3). The
turn-off mass M* is increasing with redshift as:
= (3 +
n) / 3, and n the power-law slope of the
primordial fluctuations (n = -1 here, so that
= 2/3). The
turn-off mass M* is increasing with redshift as:
|
Following Blain et al. (1999c), we also write the merger rate as a function of M and z under the form:
|
This shape (with  = 1.7 and
 = 1.4) has been
chosen so that the merger rate is the sum of the net evolution
of the Press-Schechter distribution at any mass, plus a specific
term, indicating that the merger probability is
maximum at equal masses, and is exponentially vanishing at high mass ( cf.
Blain & Longair
1993).
= 1.4) has been
chosen so that the merger rate is the sum of the net evolution
of the Press-Schechter distribution at any mass, plus a specific
term, indicating that the merger probability is
maximum at equal masses, and is exponentially vanishing at high mass ( cf.
Blain & Longair
1993).
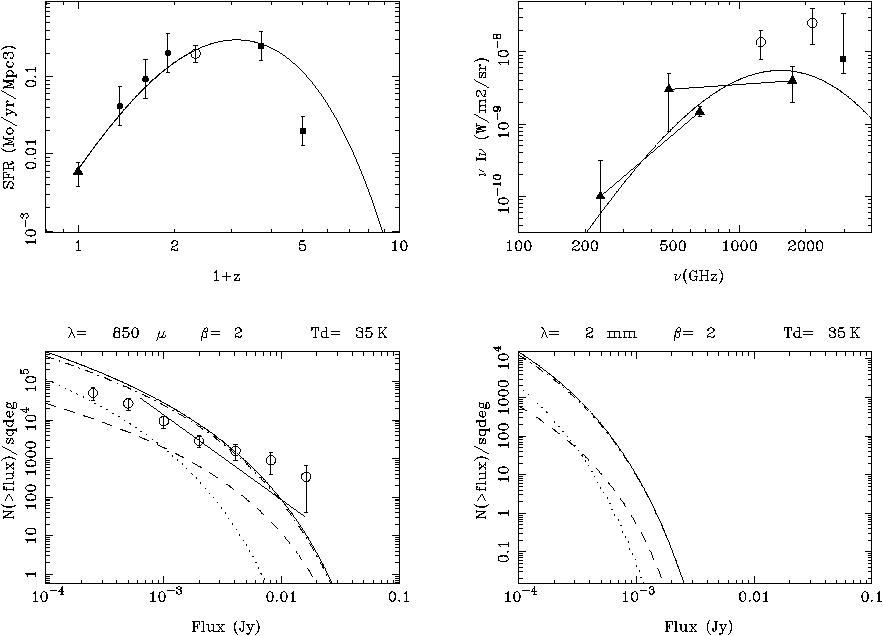
This gives the number of mergers at each epoch, but the efficiency of mergers in terms of star-formation must also vary considerably with redshift, with a peak at z ~ 2, to agree with the observations (such as in Fig. 5). Also, the integration over all redshifts of the flux of all sources should agree with the cosmic infrared background detected by COBE (Fig. 5). These contribute to reduce the number of free parameters of the modelling. To fit the source counts, however, another parameter must be introduced which measures the rate of energy released in a merger (or the life-time of the event): this rate must increase strongly with redshift (cf. Blain et al. 1999d). Once the counts are made compatible with the submm observations, the model indicates what must be the contributions of the various redshift classes to the present counts (cf. Fig. 5). It is interesting to note that the intermediate redshifts dominate the counts (2 < z < 5), if we allow the star formation to begin before z = 6. At higher dust temperature, the counts are dominated by the highest redshifts (z > 5). But these contributions depend strongly on the adopted shape of the star-forming efficiency versus z. Observations of these counts and their redshift distribution will therefore bring a lot of insight in the physiscs of early protogalaxies.
|
Figure 5.
Top left: History of the star formation rate, adopted by
the hierarchical model used here, compared with observations.
The point at z = 0 is from
Gallego et al. (1995),
the 3 following ones (full circles) from
Flores et al. (1999),
the empty circle from
Yan et al. (1999),
and the two high redshift points (filled squares), from
Pettini et al. (1998).
Top right: Predictions of the model for the far-infrared cosmic
background: the observations have been used to constrain the parameters
of the model. The filled triangles with a line joining them
symbolise the spectrum derived by
Puget et al. (1996)
from COBE, the filled circles are from
Hauser et al. (1998),
and the filled square from
Dwek et al. (1998).
Bottom left and right: Source counts predicted at 850 µm
and 2mm respectively: the solid line is the total. Dash is the lowest
redshifts (z < 2); Dot-dash, intermediate (2 < z < 5);
Dots are the highest redshifts (z > 5).
The emission from the dusty starbursts have been assumed a
grey-body at a temperature of 35K, and an opacity varying
as |
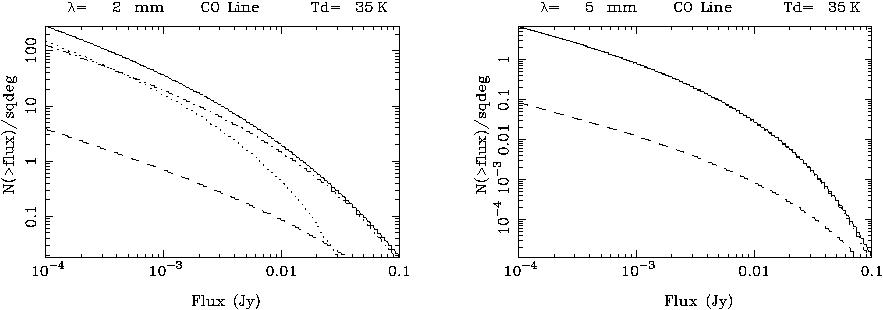
It is possible to derive also the source counts for the CO line emission.
The spectral energy distribution is now obtained
with a comb-like function, representing the rotational ladder,
convolved with a Planck distribution of
temperature equal to the dust temperature, assuming the lines optically
thick. The frequency filling factor is then proportional to the
rotational number, and therefore to the redshift, for a given observed
frequency. The width of the lines have been assumed to be 300km/s.
The derived source numbers are shown in Fig. 6.
Note how they are also dominated
by the high redshift sources. It is however not useful to
observe at  below 1mm for
high-z protogalaxies, but
instead to shift towards = 1cm.
below 1mm for
high-z protogalaxies, but
instead to shift towards = 1cm.
|
Figure 6.
Left Source counts for the CO lines at an observed frequency
of 2mm, assuming optically thick gas at Tex = 35K.
Right Same for |
 2. The empty circles
are data from
2. The empty circles
are data from