


The UV Region
CCM noted a correlation between the value of R-1 (as
determined
from IR/optical photometry) and the values of A( ) / A(V) (i.e.,
total extinction at
normalized by total extinction at V) at
UV wavelengths using parametrized extinction curves for a subset of 29
stars from the FM sample. They consequently derived a complex
polynomial expression to reproduce the wavelength- and R-
dependences. We approach the problem slightly differently and note
that the essence of the CCM result is two correlations involving the
coefficients of the FM fitting function originally used to parametrize
the extinction curves studied by CCM. We thus derive the functional
forms of these correlations and retain the FM fitting function to
compute the values of E ( - V) / E (B - V) for wavelengths < 2700 Å
) / A(V) (i.e.,
total extinction at
normalized by total extinction at V) at
UV wavelengths using parametrized extinction curves for a subset of 29
stars from the FM sample. They consequently derived a complex
polynomial expression to reproduce the wavelength- and R-
dependences. We approach the problem slightly differently and note
that the essence of the CCM result is two correlations involving the
coefficients of the FM fitting function originally used to parametrize
the extinction curves studied by CCM. We thus derive the functional
forms of these correlations and retain the FM fitting function to
compute the values of E ( - V) / E (B - V) for wavelengths < 2700 Å
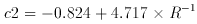
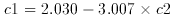
Figure 5 illustrates the two correlations. The top panel shows a plot of the FM parameter c2 (representing the slope of the linear UV extinction component) vs. R-1 (filled circles) along with a least squares estimate of the linear relationship between the two (dashed line). The data are for a subset of the FM sample for which IR photometry could be used to deduce the value of R (see below), with the addition of the sightline toward HD 210121 (Welty & Fowler 1992; Larson et al. 1996). This represents the only convincing correlation between R and the properties of the UV extinction curve (see, e.g., Jenniskens & Greenberg 1993). The equation of the least-squares fit to the data is
No physical interpretation or significance is placed on the form of the
adopted functional relationship between R and c2; it is
merely that
which best reproduces the observed correlation. We note, however, that
the intrinsic slope of extinction in the optical region is proportional
to R-1, and that eq. A1 thus simply implies that the
slopes of the
extinction curves in the UV and optical vary together in a linear
manner - as optical extinction steepens, UV extinction steepens.
Figure 5. Left Panel: Slope of the
UV linear extinction component c2 plotted against
R-1 (filled circles) for 31 sightlines from
the
Fitzpatrick & Massa 1990
(FM) sample plus HD 210121 (at
R-1 = 0.45). The adopted linear relationship between
these quantities is
indicated with the dashed line and given by c2 = -0.824 +
4.717R-1. Right Panel: Intercept of the UV linear
extinction component c1 plotted against the linear slope
c2 (filled
circles) for the full set of ~ 80 extinction curves from the FM
catalog. The adopted linear relationship between these parameters is
indicated by the dashed line and given by c1 = 2.030 - 3.007
c2. The relationship between c1 and c2 implicit in
the CCM formula is shown by the dotted line.
The bottom panel of Figure 5 shows the
well-known relationship between
slopes (c2) and intercepts (c1) of the linear background
component
(FM; Carnochan 1986;
Jenniskens & Greenberg
1993).
The data are for
the full set of 80 curves from FM, plus HD 210121, and minus the Orion
Nebula stars (HD 36982, 37022, 37023, and 37061) which suffer from
scattered light contamination (which mainly affects the linear intercept).
The equation of the least squares fit to this relationship (dashed
line), is
We use the following mean values for the other four parameters required
to specify UV extinction curves with the FM formula: x0 (bump
position) = 4.596 µm-1;

 (bump width) = 0.99
µm-1; c3 (bump strength) = 3.23; and
c4 (FUV curvature) = 0.41.
(bump width) = 0.99
µm-1; c3 (bump strength) = 3.23; and
c4 (FUV curvature) = 0.41.