


A general impression one could draw from the cone diagrams of the ESP and LCRS surveys, and which is also taking shape within the 2dF preliminary plot, is that inhomogeneities in the distribution of galaxies are limited to scales of 100 - 200 h-1 Mpc, which are fairly well covered by these modern surveys. Using Bob Kirshner words, we seem to be finally seeing ``the end of greatness'', that is, we are finally sampling (at least in two dimensions) sizes which contain the relevant clustering scales of our Universe. This was not the case until a few years ago, when any new survey used to discover larger and larger structures. A clear example of this situation is provided by the combined CfA2-SSRS2 sample that we have shown in Figure 1. Here the largest superclusters have sizes ~ 150 h-1 Mpc, comparable to the survey depth, and spanning its volume from one side to the other.
It was because of evidences like these, together with the power-law behaviour shown by galaxy clustering (see Section 5.1), that some researchers suggested that the large-scale galaxy distribution of galaxies could be described as a ``fractal dust'' (e.g. [43]). This fractal behaviour, if extrapolated to indefinite scales, i.e. if not up-bounded by a transition to a homogeneous distribution, has some rather dramatic consequences on our statistical description of large-scale structure [44]. No mean density can be defined, and as a consequence the whole concept of density fluctuations (with respect to a mean density) becomes nonsensical.
A quite intense debate has developed in the last few years about whether the available surveys really provide evidence for homogeneity on the largest scales explored, with - as it often happens - a tendency of the opposing views to crystallize on polarized positions. As an attempt to clarify a bit the situation by addressing this very basic question in a possibly objective way, in [45] I reviewed some of the best available redshift survey data from this point of view. The application of some simple counting statistics (6) , corroborated also by other more detailed analyses [46, 30], seemed to show a general convergence to a homogeneous distribution, rather than supporting a fractal behaviour to the largest explorable scales. At the same time, however, it was clear (as previously remarked [47]), that the clustering of galaxies on small and intermediate scales could be described by power-law ranges consistent with a fractal, scale-free distribution. Similar conclusions have been reached more recently by Martinez [48].
3.1. Density Fluctuations and Variances
Once we are convinced that indeed a transition to homogeneity does
exist on some large scale around ~ 100 - 200 h-1 Mpc so
that we can define a mean density of the Universe in a sensible way,
we can quantify the distribution of objects and matter in terms of
density fluctuations.
Given a mean density n, and a spherical volume of radius
R, we can measure the fluctuation
 N / N in the
number of objects within
such spheres, and compute the variance
N / N in the
number of objects within
such spheres, and compute the variance
 gal2(R)
of this quantity.
We shall then find that for typical optically-selected samples
this is a decreasing function of R (galaxies are indeed clustered!),
with gal2
gal2(R)
of this quantity.
We shall then find that for typical optically-selected samples
this is a decreasing function of R (galaxies are indeed clustered!),
with gal2
 1 for
R = 8 - 10 h-1 Mpc, depending slightly on the
mean luminosity of the objects considered. In particular,
modern redshift surveys, with typical sizes exceeding a few
100 h-1 Mpc,
are probing volumes of the Universe over which
gal2
is significantly smaller than unity.
1 for
R = 8 - 10 h-1 Mpc, depending slightly on the
mean luminosity of the objects considered. In particular,
modern redshift surveys, with typical sizes exceeding a few
100 h-1 Mpc,
are probing volumes of the Universe over which
gal2
is significantly smaller than unity.
Unless mass is more clustered than ligh
(7) , this should be
reflected by a similar or even smaller variance
 2 in the
mass density fluctuation field
/
. When
< 1,
linear perturbation theory can be applied and comparison of models to
observations becomes easier. In fact, if clustering is driven by
gravitational instability, the amplitude of perturbations in the linear regime
grows with time in a way which is independent of the spatial
wavelength of the perturbation itself (see e.g.
[49],
[50],
[51]).
For this reason, the evolution of any statistics describing the
distribution of amplitudes at different wavelengths, as is
the case for the power spectrum P(k), and to some extent also
of its Fourier transform the two-point correlation function
2 in the
mass density fluctuation field
/
. When
< 1,
linear perturbation theory can be applied and comparison of models to
observations becomes easier. In fact, if clustering is driven by
gravitational instability, the amplitude of perturbations in the linear regime
grows with time in a way which is independent of the spatial
wavelength of the perturbation itself (see e.g.
[49],
[50],
[51]).
For this reason, the evolution of any statistics describing the
distribution of amplitudes at different wavelengths, as is
the case for the power spectrum P(k), and to some extent also
of its Fourier transform the two-point correlation function
 (r) ,
will be described by a simple growth in amplitude, without any change
in the shape.
(r) ,
will be described by a simple growth in amplitude, without any change
in the shape.
This means in practice that if we are able to measure
accurately the present shape of P(k) or
(r) on scales
where this
behaviour still holds, we have a direct probe of the initial
distribution of fluctuations, which can be directly compared to
the linear power spectra predicted by the different models. This is
one of the main motivations for extending redshift surveys to
larger and larger volumes of the Universe.
3.2. Mapping Light, Mapping Mass
In the previous paragraph, we have quickly touched on the possibility that the variances we observe in the distribution of light and mass are not strictly the same. In fact, as we discussed, whatever redshift survey we are performing, we are not mapping the distribution of mass in the Universe, but rather the distribution of objects that can be ``seen'' in some band of the electromagnetic spectrum and that serve as possible tracers of matter distribution. We have seen, for example, that the LCRS and ESP are selected in different photometric bands, red and blue respectively, with a further important cut in surface brightness for the LCRS, and how these differences affect measured properties as the luminosity function [27].
While the LCRS and ESP galaxies do not show significant variations in the global clustering properties (i.e., they apparently trace the density field in similar ways), more serious differences are found for example between optically-selected and infrared-selected samples, as notably shown by the large surveys based on the IRAS satellite infrared survey (8) . A selection based on the IRAS infrared flux favours star-forming galaxies and avoids rich clusters. Consequently, the IRAS density field is smoother than that generally seen by optically-selected galaxies, with a smaller correlation length (~ 3 h-1 Mpc vs. 5 h-1 Mpc). Does this mean that IRAS galaxies trace the mass density field, i.e., that they are unbiased objects? The only way to answer this question is to compare the galaxy distribution to the mass distribution derived independently from dynamical observations of the peculiar velocity field (9) (see e.g. [54]) and for the case of IRAS galaxies, the answer is probably yes.
To further clarify what we mean by biased tracers, let us have a
look at the distribution of different
morphological types. It is well known that different galaxy types
find themselves preferentially within different density regimes:
elliptical and S0's favour high-density regions, while spirals are
much more common in low-density environments. This is the so-called
morphology-density relation (e.g.
[55]),
and it inevitably
affects the way in which different types trace the underlying mass
density field. In Figure 6 I have included
an estimate of the real-space two-point correlation function
(r) for early-
and late-type galaxies,
obtained from the projected function
wp(rp)
[56].
The plot shows how the morphology-density relation translates into a stronger
clustering for elliptical galaxies. So, if we were for some reason
able to detect only elliptical galaxies and assumed that they trace
the mass, we would at first glance conclude that matter in the
Universe is on the average more clustered than it really is.

|
Figure 6. Comparison of the spatial
correlation functions of early- and
late-type galaxies. The left panel shows the so-called projected correlation
function wp(rp), i.e. a projection
of galaxy correlations perpendicular to
the line of sight which has the advantage of being free from the distortions
induced by peculiar velocities (see
e.g. [56]
for details). The right panel gives the confidence
ellipses for the values of the correlation length r0
and slope |
All these examples pertain to the grand challenge of understanding how radiation emitted by cosmic objects (at any wavelength) is related to mass, i.e. the so-called bias, and even more importantly how this relation evolves with cosmic time. One way to define this is to write that
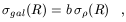
| (1) |
where the linear bias b is in general a function of scale R and time t. A proper comprehension of the behaviour of b(r, t) is becoming crucial now that observational data on clustering at very different cosmic epochs are being accumulated (e.g. [57]). For this reason, considerable energy has been spent in the last couple of years in developing physically motivated bias models (e.g. [58, 54, 59]).
6 In particular, the growth of the number of objects N(R) as a function of the distance R from the observer for a volume-limited sample extracted from a given survey. Back.
7 It is more naturally expected, as we shall discuss in Section 3.2, that light is either clustered as mass or to some degree more clustered. However, one could in principle also conceive scenarios in which galaxy formation is suppressed by some physical mechanism in high-density regions, so that galaxies would look more homogeneously distributed than the real mass density field. Back.
8 For reasons of space, I will not discuss in detail here the IRAS-based redshift surveys, like the 1.2 Jy, QDOT and PSCz redshift surveys, a part from mentioning some of the important results produced from them. Details on the first two can be found in [4], while for the most recent PSCz, see [52]. Back.
9 One new powerful method for recovering the true mass distribution is provided by the weak lensing distortions induced by large-scale structures on the background galaxy images (e.g. [53]). Back.
 ,
when a power-law spatial correlation function
,
when a power-law spatial correlation function