Copyright © 1981 by Annual Reviews. All rights reserved
| Annu. Rev. Astron. Astrophys. 1981. 19:
373-410 Copyright © 1981 by Annual Reviews. All rights reserved |


Analysis of radio source counts and the luminosity volume test have led to the well-known result that the spatial distribution of the classical on extended radio sources varies dramatically with cosmic epoch. In particular, near z ~ 1 the most luminous sources appear to be more a by a factor ~ 103 compared with their local density, while the less luminous ones show little or no such evolution. [See Wall (1980) and Wall et al. (1980) for recent discussions.]
Because of their relatively flat spectra, the compact sources are more prominent in surveys made at short wavelengths. The Parkes 11 cm Survey (Wall 1977, Peacock & Wall 1981) and the NRAO and Bonn 6 cm Surveys (Pauliny-Toth 1977, Pauliny-Toth et al. 1978a, Kellermann 1980b, Kuhr 1980, Ledden et al. 1980) between them are complete over the whole sky and provide a complete sample of several hundred of the brightest sources; for limited regions, they reach source densities of 3 x 10⁴ Sr-1. Observational emphasis during the past few years has concentrated on obtaining optical identifications, red shifts, and radio spectra for large numbers of sources over a wide range of flux density, and these data have provided the observational material to study the space distribution of the compact radio sources (Kellermann 1980b, Wall et al. 1981 and references therein).
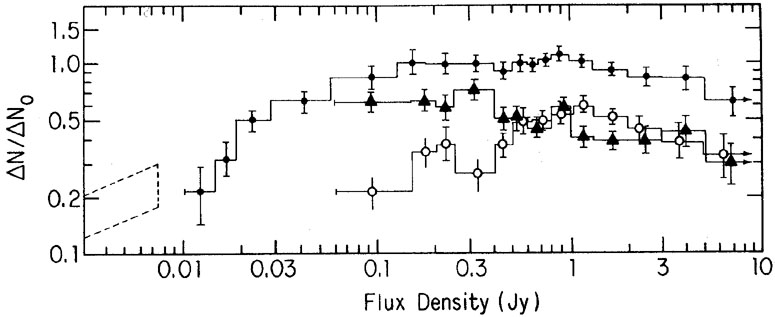
Figure 8 shows the differential 6-cm source count normalized to the hypothetical static Euclidean universe [i.e. N(S) = 60 S-1.5] At this wavelength more than half of the stronger sources are compact. Because of the wide dispersion in spectra index, the rather sharp peak seen in the long wavelength differential count (Pearson & Kus 1978, Wall et al. 1980) is spread out over a wide range of flux density.
Figure 8 also shows the 6-cm count separated into the "flat-spectrum" and "steep-spectrum" sources, roughly corresponding to the compact and extended sources. As in the long wavelength surveys, the count for the steep-spectrum sources shows an excess over the canonical static Euclidean model down to ~ 60 mJy. Although no spectral data are available for the weaker sources, the total count requires that the steep-spectrum count converge below this flux density.
For the flat-spectrum sources (the compact sources), the count peaks
near 1 Jy and converges rapidly below this value. Since the compact
sources are mainly identified with intrinsically powerful quasars
typically having red shifts 0.5
 z
3, it appears that at a level ~
1 Jy, most of the strong radio quasars are detected, and surveys made
to lower flux densities do not detect many more. Similar results are
obtained from an analysis of the flat-spectrum sources found in the
Parkes 11-cm surveys
Wall 1977,
Wall et al. 1981).
This difference in
the apparent spatial distribution between the two classes is also
reflected in the luminosity-volume or <V/Vm>
tests. For the strong,
steep-spectrum quasars, various authors have determined a value of
<V/Vm> ~ 0.65 (e.g.
Schmidt 1968,
Lynds & Wills 1972,
Fanti et al. 1973,
Masson & Wall 1977,
Wills & Lynds 1978)
corresponding to the
strong spatial evolution deduced from the low frequency surveys. For
the strong flat-spectrum sources, on the other hand, values of
<V/Vm>
~ 0.55 have been reported by Schmidt
(1976,
1978),
Masson & Wall (1977),
Wills & Lynds (1978),
and Kuhr (1980).
z
3, it appears that at a level ~
1 Jy, most of the strong radio quasars are detected, and surveys made
to lower flux densities do not detect many more. Similar results are
obtained from an analysis of the flat-spectrum sources found in the
Parkes 11-cm surveys
Wall 1977,
Wall et al. 1981).
This difference in
the apparent spatial distribution between the two classes is also
reflected in the luminosity-volume or <V/Vm>
tests. For the strong,
steep-spectrum quasars, various authors have determined a value of
<V/Vm> ~ 0.65 (e.g.
Schmidt 1968,
Lynds & Wills 1972,
Fanti et al. 1973,
Masson & Wall 1977,
Wills & Lynds 1978)
corresponding to the
strong spatial evolution deduced from the low frequency surveys. For
the strong flat-spectrum sources, on the other hand, values of
<V/Vm>
~ 0.55 have been reported by Schmidt
(1976,
1978),
Masson & Wall (1977),
Wills & Lynds (1978),
and Kuhr (1980).
|
Figure 8. Differential log N-log S relation, normalized to an integral count N(S) = 60 S-1.5. The counts for the flat spectrum sources (circles) and steep spectrum sources (triangles) are shown separately. The dotted area on the left represents the possible range for the total counts based on the P(D) analysis. Data are taken from the various NRAO and MPI 6-cm survess summarized by Kellermann (1980), Kuhr (1980), and Ledden et al. (1980). |
The apparent difference in the slope of the log N-log S
counts and
the values of <V/Vm> has generally been interpreted as
a difference in
the spatial evolution of the two spectral classes with the
flat-spectrum sources showing a more uniform space density
(Schmidt 1976,
1978,
Masson & Wall 1977,
Wall 1980).
This is difficult to
understand, however, as optical counts and <V/Vm>
studies of optically
selected quasars show even more extreme evidence for spatial evolution
than the strong steep-spectrum radio sources. At z ~ 2,
Schmidt & Green (1980)
estimate an increase in the space density of optically
selected quasars of ~ 105 over the local density. Thus if
flat-spectrum radio sources are nearly uniformly distributed, the
probability of a quasar's becoming a strong compact radio source must
decrease with increasing z, or increase with cosmic epoch in
just such a way as to appear to cancel the factor of 105
in spatial evolution of
the parent quasars. This behavior would be in dramatic contrast to
that of E galaxies for which the source counts and
<V/Vm> tests
indicate that the probability of becoming a strong radio source
increases with z, or decreases with epoch, at least for z
1
(Longair 1978).
It is not clear, however, whether the differences in the source counts can be more readily interpreted as due to the difference in the luminosity functions, and the corresponding difference in the volumes of space sampled by different sources in the two classes chosen to a given flux level. Since the slope of the source count and the value of <V/Vm> depend critically on the flux density interval chosen, it is not obvious in view of the different luminosity functions how to interpret comparisons made at the same flux density level (Kellermann 1980b, Kuhr 1980).
A further problem in understanding the apparent difference in space distribution is that both compact and extended emission are typically associated with the same optical object (see Section 5) with the classification depending on the relative strength of the compact and extended emission. Most optically selected quasars show no radio emission (Sramek & Weedman 1978, Smith & Wright 1980), but in quasars that contain extended emission the probability of finding a compact source is much larger (Owen et al. 1978, Potash & Wardle 1979) so that the two phenomena are not independent, and their apparent very different spatial evolution is difficult to understand.
Masson & Wall (1977) and Kuhr (1980) have also suggested possible differences in the distribution of so-called "flat-spectrum" and "inverted- spectrum" sources, but the statistics are too limited to make any definite statements.