


Despite the sizable observational effort invested during the last decade, it is clear that much can be gained from a survey having greater sensitivity to the detection of emission lines. The sensitivity can be improved in at least four ways - by taking spectra with higher signal-to-noise ratio (S/N) and spectral resolution, by using a narrower slit to better isolate the nucleus, and by employing more effective methods to handle the starlight correction.
Using a double CCD spectrograph mounted on the Hale 5-m reflector at Palomar
Observatory, high quality, moderate-resolution, long-slit spectra were
obtained for a magnitude-limited (BT
 12.5 mag) sample of 486 northern
(
12.5 mag) sample of 486 northern
( > 0°) galaxies
(Filippenko & Sargent 1985,
1986;
Ho, Filippenko, &
Sargent 1995).
The red camera covered the range
6210-6860 Å with ~ 2.5 Å resolution, while the corresponding values
for the blue camera were 4230-5110 Å and ~ 4 Å. Most of the
observations were obtained with a narrow slit (generally 2", and
occasionally 1"), and the exposure times were suitably long (up to 1 hr or
more for some objects with low central surface brightness) to secure data of
high S/N. This survey contains the largest data base of homogeneous and
high-quality optical spectra of nearby galaxies yet published. The selection
criteria of the survey ensure that the sample is a good representation of the
local (z
> 0°) galaxies
(Filippenko & Sargent 1985,
1986;
Ho, Filippenko, &
Sargent 1995).
The red camera covered the range
6210-6860 Å with ~ 2.5 Å resolution, while the corresponding values
for the blue camera were 4230-5110 Å and ~ 4 Å. Most of the
observations were obtained with a narrow slit (generally 2", and
occasionally 1"), and the exposure times were suitably long (up to 1 hr or
more for some objects with low central surface brightness) to secure data of
high S/N. This survey contains the largest data base of homogeneous and
high-quality optical spectra of nearby galaxies yet published. The selection
criteria of the survey ensure that the sample is a good representation of the
local (z  0) galaxy
population
(Fig. 2), and the
proximity of the objects (median distance = 17 Mpc) enables fairly good
spatial resolution to be achieved (typically
0) galaxy
population
(Fig. 2), and the
proximity of the objects (median distance = 17 Mpc) enables fairly good
spatial resolution to be achieved (typically
 200 pc).
|
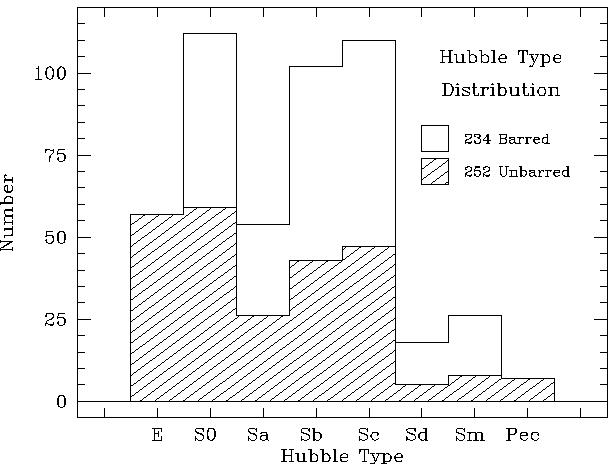
Figure 2. Distribution of Hubble types for the 486 galaxies in the survey. Ordinary (unbarred) galaxies are shown in the hatched histogram, and barred (SB and SAB) galaxies in the unhatched histogram. Classifications taken from de Vaucouleurs et al. (1991). |
A common strategy for removing the starlight from an integrated spectrum is that of ``template subtraction,'' whereby a template spectrum devoid of emission lines is suitably scaled to, and subtracted from, the spectrum of interest to yield a continuum-subtracted, pure emission-line spectrum (e.g., Costero & Osterbrock 1977; Filippenko & Halpern 1984; Filippenko & Sargent 1988; Ho et al. 1993). In practice, the template is derived either from the spectrum of a different galaxy or from the spectrum of an off-nuclear position in the same galaxy. This approach, however, suffers from some limitations. For instance, the absorption-line galaxy chosen as the template may not exactly match the stellar component of the object in question; previous studies generally invested limited observing time to the acquisition of template spectra. In the case where an off-nuclear spectrum is used as the model, it may not be completely free of emission, and one cannot be sure that radial gradients in the stellar population are absent.
To perform the starlight subtraction in a more objective and efficient manner
than has been done in the past, a modified version of the template-subtraction
technique that takes advantage of the large number of absorption-line galaxies
in the survey was developed
(Ho et al. 1996c).
Given a list
of input template spectra and an initial guess of the velocity dispersion, the
 2-minimization algorithm
of Rix & White (1992)
solves for the systemic
velocity, the line-broadening velocity dispersion, the relative contributions
of the various templates, and the general continuum shape. The best-fitting
model is then subtracted from the original spectrum, yielding a pure
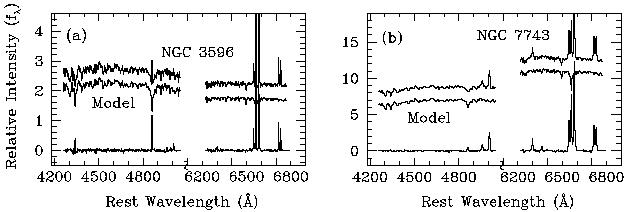
emission-line spectrum. Figure 3 illustrates
this process for
the H II nucleus in NGC 3596 and for the
Seyfert 2 nucleus in NGC 7743. In the case of NGC 3596, the model consisted
of the combination of the spectrum of NGC 205, a dE5 galaxy with a substantial
population of A stars, and NGC 4339, an E0 having a K-giant spectrum. Note
that in the original observed spectrum (top),
H
2-minimization algorithm
of Rix & White (1992)
solves for the systemic
velocity, the line-broadening velocity dispersion, the relative contributions
of the various templates, and the general continuum shape. The best-fitting
model is then subtracted from the original spectrum, yielding a pure
emission-line spectrum. Figure 3 illustrates
this process for
the H II nucleus in NGC 3596 and for the
Seyfert 2 nucleus in NGC 7743. In the case of NGC 3596, the model consisted
of the combination of the spectrum of NGC 205, a dE5 galaxy with a substantial
population of A stars, and NGC 4339, an E0 having a K-giant spectrum. Note
that in the original observed spectrum (top),
H , [O III]
 4959, 5007, and [O I] 6300
were hardly visible, whereas after starlight
subtraction (bottom) they can be easily measured. The intensities of both
H
4959, 5007, and [O I] 6300
were hardly visible, whereas after starlight
subtraction (bottom) they can be easily measured. The intensities of both
H and
H
and
H have been modified
substantially, and the ratio of the two
[S II]
6716, 6731 lines changed. The effective template for
NGC 7743 made use of NGC 205, NGC 4339, and NGC 628,
an Sc galaxy with a nucleus dominated by A and F stars.
have been modified
substantially, and the ratio of the two
[S II]
6716, 6731 lines changed. The effective template for
NGC 7743 made use of NGC 205, NGC 4339, and NGC 628,
an Sc galaxy with a nucleus dominated by A and F stars.
|
Figure 3. Illustration of the method of starlight subtraction. In each panel, the top plot shows the observed spectrum, the middle plot the best-fitting ``template'' used to match the stellar component, and the bottom plot the difference between the object spectrum and the template. In the case of NGC 3596 (a), the model was constructed from NGC 205 and NGC 4339, while for NGC 7743 (b), the model was derived from a linear combination of NGC 205, NGC 4339, and NGC 628. |