

There are now several results on H0 obtained using the SZ effect. These are summarized in Table 2, and another compilation, covering the period up to about two years ago, may be found in Rephaeli (1995a). The majority of entries in this table have been made using single-dish telescopes, rather than interferometers, and involve single cuts across the clusters rather than full maps, as in the case of the Ryle. This makes it more difficult to establish whether errors are being made with regard to the cluster shape, and (at least in the case of the Birkinshaw results) establishing proper zero levels can be difficult. There are also other Caltech measurements which have been made, but which are not yet available in print.
| Instrument/group | Cluster | H0 result (km s-1 Mpc-1) | Comments |
| Ryle | A2218 | 38+17-12 | No cooling flow |
| A1413 | 47+18-12 | Elliptical, cooling flow | |
| Birkinshaw 40 m | A2218 | 65+25-25 | |
| A665 | 40+20-20 | ||
| OVRO 5.5m | Coma | 74+29-24 | |
| CSO/SuZie | A2163 | 60+40-23 | (isothermal atmosphere) |
| 78+60-40 | (hybrid model) | ||
Some recent measurements, which hold great promise for the future, have
come from
the Caltech SuZie group, working on the Caltech Submillimeter
Observatory in Hawaii.
They use a differencing bolometer scheme, coupled with drift scans
across the source,
which provides good stability and rejection of atmospheric
fluctuations. The wavelengths
observed are 1.2, 1.4 and 2.2 mm, which are properly spaced to make an
attempt at
separating the kinetic and thermal SZ effects, with preliminary results
as mentioned above.
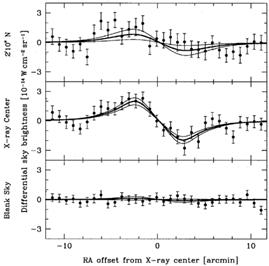
The  = 2.2 mm scans across
the cluster A2163, which lead to the H0
results given in Table 2, are shown in
Fig. 6, taken from
Holzapfel et
al. (1997b).
The cluster A2163 is the
hottest known (Te ~ 14 keV), and
Holzapfel et
al. (1997b)
emphasize that this makes it
necessary to use the correct relativistic formulae for the
frequency dependence and amplitude of the SZ effect
(Rephaeli 1995b).
Also, it is gradually emerging that A2163 may have significant substructure
(Markevitch 1996).
It may therefore not be ideal for attempting
to measure H0. The two values shown for this cluster
in the Table result from assuming
either a standard isothermal atmosphere, which gives
H0 = 60+40-23 km s-1
Mpc-1 or a hybrid polytropic/isothermal atmosphere (based on
the model of
Hughes et al. 1988)
which yields H0 = 78+60-40 k
s-1 Mpc-1. Full SZ scans taken with SuZie are now
available for
the cluster A1689, and H0 values from this are
expected shortly.

|
Figure 6. Coadded difference signals from the CSO/SuZie A2163 observations for (top) a region 2.2 arcminutes to the south of the cluster center; (middle) across the X-ray center and (bottom) on a region of blank sky. The effective beam switch angle is 4.6 arcminutes. The heavy and light curves are the best fit isothermal models and their one-sigma errors respectively (Taken from Holzapfel et al. 1997b). |
What final accuracy on H0 can we expect from the SZ method? With maybe 25 clusters available from which to work out the effect (about the maximum number that are likely to be done in the near to medium distance future), one expects the main sources of error to average out to perhaps an 8% error in H0 (This is an estimate from Holzapfel et al. (1997b)). Sources of error which will not average out in this way, however, are the uncertainties in X-ray and radio calibration, which will probably limit the final accuracy to about 10%. Although this will be very valuable information, it is of interest to see whether there are other ways in which the CMB can be used to constrain H0, and it is to this that we now turn.