


We present some histograms and plots which give us a first insight into the global properties of the compiled Liner sample. A detailed statistical analysis of these properties will be presented in a forthcoming paper.
|
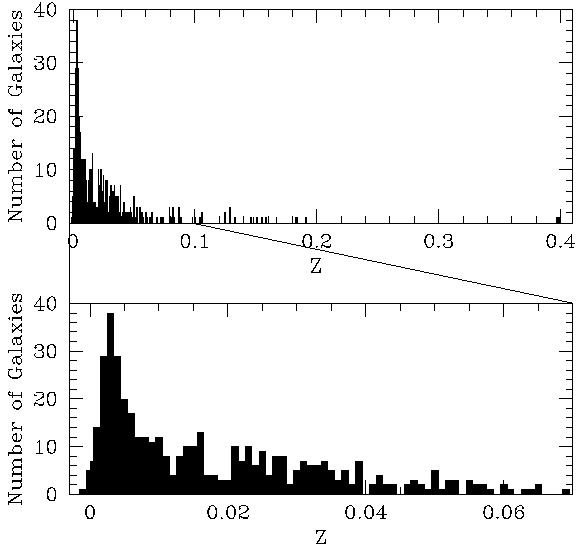
Figure 1. Redshift distribution of the objects in the catalogue. |
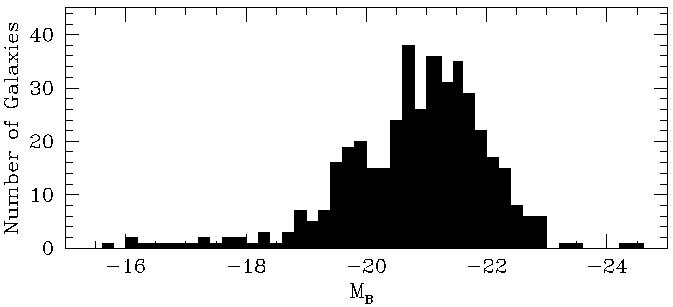
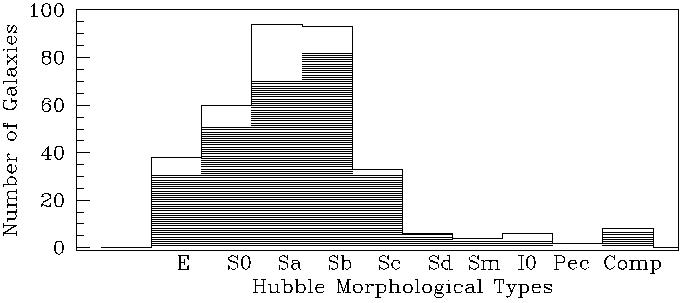
In figure 1, the z distribution is shown in which one can see that most Liners cluster around z = 0.006. The most distant confirmed Liner is at z = 0.39, and only 2 sources have z > 0.2. It is expected that IR selected Liners will increase the population at higher redshifts (i.e. Wu et al. 1998, see also the redshift distribution of the 1 Jy sample reported by Kim & Sanders 1998). The MB and Hubble type histograms are shown in figures 2 and 3. It has to be noticed that the host galaxies of Liners (``pures''+``transitions'') are mostly normal spirals with a median MB value of -20.7. Ho (1996) found a median MB = -20.2 for ``pure'' Liners. Liner type spectra do not appear very often in dwarf systems. The morphological distribution point out that Liners are preferentially in early type galaxies. The later Hubble types hosting Liner nuclei are mostly related to perturbed systems as judged from the Digitized Sky Survey (DSS).
|
Figure 2. MB magnitude of underlying galaxy distribution. |
|
Figure 3. Morphologic (Hubble) type distribution of underlying galaxies. The shaded zone covers those galaxies which do not show any peculiarities in their morphology. |
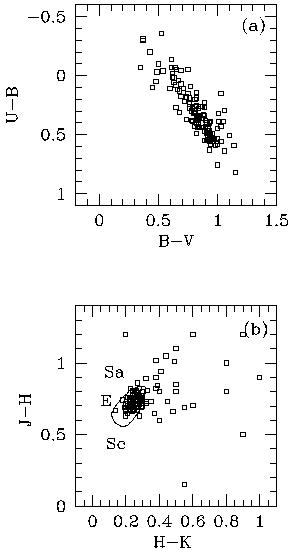
Two color (optical and near IR) diagrams are shown in figure 4, upon which the locus of normal galaxies has been overlaid. While the optical colors do not show strong departures from those of normal galaxies, the near-IR show a strong scatter of H-K colors, larger than 0.4. From the galaxies producing the large scatter that we were able to identify (19), 8 come from the ULIRG class (Duc, Mirabel & Maza 1997), 2 are strong radio galaxies, in four of them an apparent distortion in the morphology is visible in the DSS. Therefore the large spread in figure 4b can be attributed to peculiar colors produced by a merging process.
|
Figure 4. Optical (a) color-color diagrams and (b) near IR color-color diagrams of underlying galaxies. In Fig 4b. the locus of ``normal'' Sa, Sc & E (Hunt et al. 1997) galaxies is delineated. |
Diagnostic Diagrams (following
Veilleux & Osterbrock
1987)
to separate
missclassified Liners are presented in figure 5.
Squares denote the values for line ratios of Liners. We also show the
regions (loci) corresponding to the ratios of nuclear spectra of
Seyfert 2 galaxies or to HII and blue compact galaxies (and/or spectra
of giant HII regions in galaxies). We can see that several objects do
not lie within the Liner region in all three diagrams simultaneously,
but this should not
be surprising if we take into account that we have included all the so
called "transition" objects (circles) from
Ho, Filippenko &
Sargent 1997.
Still, there are objects which lie out of the liners loci in all
three diagrams, and thus, on the basis of the ratios
[OII] 3727/[OIII] 5007,
[OI] 6300/[OIII] 5007 &
[NII] 6583/H
3727/[OIII] 5007,
[OI] 6300/[OIII] 5007 &
[NII] 6583/H , they should be classified rather as
Seyfert 2 galaxies (16 objects) and HII galaxies (6 objects).
, they should be classified rather as
Seyfert 2 galaxies (16 objects) and HII galaxies (6 objects).

|
Figure 5. Diagnostic Diagrams (following Veilleux & Osterbrock 1987). Squares denote the values for line ratios of Liners, and ``transition'' objects (circles) from Ho, Filippenko & Sargent 1997. We also show the regions (loci) corresponding to the ratios of nuclear spectra of Seyfert 2 galaxies and for HII or blue compact galaxies (and/or spectra of giant HII regions in galaxies). |
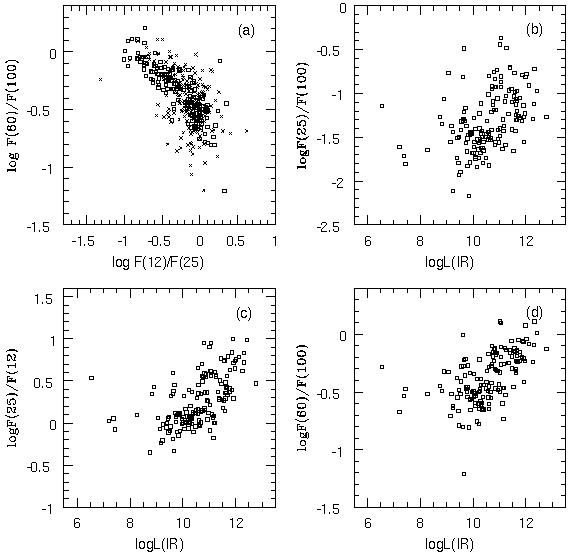
Fig. 6 shows IRAS data. In 6a the ratio F(60) / F(100) vs. F(12) / F(25) is shown for all objects in the catalog. Squares are for sources detected in all IRAS bands, and crosses for those which are not detected (or have a limit value) in at least one band. In 6b, 6c, and 6d we use only objects detected in all IRAS bands (no upper limits have been included) to plot F(25) / F(100) vs. L(FIR), F(25) / F(12) vs. L(FIR), and F(60) / F(100) vs. L(FIR). The large scatter in all the diagrams seems to point out the heterogeneous character of the sample we are dealing with. Although all the colors show the same trends, dust temperatures become hottest as the IR luminosity increase.
|
Figure 6. The IRAS data. In 6a the ratio F(60) / F(100) vs. F(12) / F(25) is shown for all objects in the catalog. Squares are for sources detected in all IRAS bands, and crosses for those which are not detected (or have a limit value) in at least one band. In 6b, 6c, and 6d we use only objects detected in all IRAS bands to plot F(25) / F(100) vs. L(FIR), F(25) / F(12) vs. L(FIR), and F(60) / F(100) vs. L(FIR). |
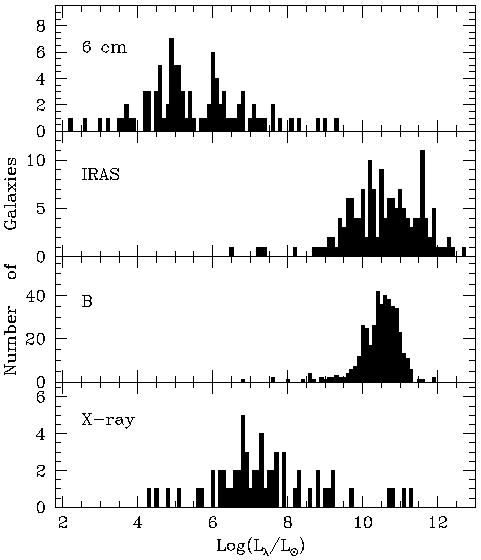
Finally, in figure 7 we present the histograms of the luminosities in all the bands from radio to X-ray frequencies. The data seem to suggest that both in radio and X-ray frequencies, the range in luminosity is quite large and cannot be considered as a well defined property of the Liner population. B and FIR luminosities, however, show a lower range in luminosities which is suggestive of a better defined global property for the reported galaxies.
|
Figure 7. The luminosity distribution in four bands: 6cm, FIR (using sources detected in all four IRAS bands), B, and X-rays. The objects used for this Figure are the same (i.e. those which have measures in all four bands from radio to X-rays). |
We are grateful to our referee for his comments that helped to improve the final version of this paper. We wish to thank Luc Binette for comments and suggestions. This work was supported by grant IN109896 from PAPIIT, UNAM (México), and DGCYT grant PB93-0139 (Spain). We like also to acknowledge Junta de Andalucía and the Instituto de Astrofísica de Andalucía (Spain) for partial financial support. R.C. acknowledges partial financial support from CONACYT and DGAPA (UNAM), México that allowed him to spend his postdoctoral year at the Instituto de Astrofísica de Andalucía. R.O. acknowledges support from DGEP, UNAM, through an undergraduate scholarship.
This research has made use of the NASA/IPAC extragalactic database (NED) which is operated by the Jet Propulsion Laboratory, Caltech, under contract with the National Aeronautics and Space Administration.