

|
Figure 2. Left: Mean comoving
density of star formation as
a function of cosmic time. The data points with error bars have been inferred
from the UV-continuum luminosity densities of
[31] (filled
dots),
[7]
(filled squares),
[35]
(filled pentagons),
[56]
(empty dot),
and [54]
(empty square).
The dotted line shows the fiducial rate, < |
It has become familiar to interpret recent observations of high-redshift
sources via the comoving volume-averaged history of star formation.
This is the mean over cosmic time of the stochastic, possibly
short-lived star formation episodes of individual galaxies, and follows a
relatively simple dependence on redshift. Its latest version, uncorrected for
dust extinction, is plotted in
Figure 2 (left panel). The measurements
are based upon
the rest-frame UV luminosity function (at 1500 and 2800 Å), assumed
to be from young stellar populations
[33]. The
prescription for a ``correct''
de-reddening of these values has been the subject of an ongoing debate.
Dust may play a role in obscuring the UV continuum of Canada-France
Reshift Survey (CFRS, 0.3 < z < 1) and Lyman-break (z  3) galaxies,
as their colors are too red
to be fit with an evolving stellar population and a Salpeter initial mass
function (IMF)
[35]. The
fiducial model of
[35] had an upward
correction factor of 1.4 at 2800 Å, and 2.1 at 1500 Å. Much
larger corrections have been argued for by [46]
(x 10 at z = 1),
[37]
(x 15 at z = 3),
and [47]
(x 16 at z > 2). As noted already by
[33] and
[35],
a consequence of such large extinction values is the possible
overproduction of metals and red light at low redshifts.
Most recently, the evidence for more moderate extinction
corrections has included measurements of star-formation rates (SFR) from
Balmer lines
by [55]
(x 2 at z = 0.2),
[17]
(x 3.1 ± 0.4
at z = 1),
and [42]
(x 2-6 at z = 3). ISO follow-up of CFRS
fields [13] has
shown that
the star-formation density derived by FIR fluxes (x 2.3 ± 0.7 at
0
  z
z  1) is
about 3.5 times lower than in
[46].
Figure 2 (right panel) depicts an
extinction-corrected (with A1500 = 1.2 mag, 0.4 mag
higher than in
[35])
version of the same plot. The best-fit cosmic star formation
history (shown by the dashed-line) produces a total EBL of 37
n W m-2 sr-1. About 60% of this is radiated in the
UV+optical+near-IR
between 0.1 and 5 µm; the total amount of starlight that is
absorbed by dust and reprocessed in the far-IR is 13 n W m-2
sr-1.
Because of the uncertainties associated with the incompleteness of
the data sets, photometric redshift technique, dust reddening, and UV-to-SFR
conversion, these numbers are only meant to be indicative. On the other
hand, the model is not in obvious disagreement with any of the observations,
and is able, in particular, to provide a reasonable estimate of the
near-IR luminosity density in the range 0
  z
z  1 (Fig. 3).

| 
|
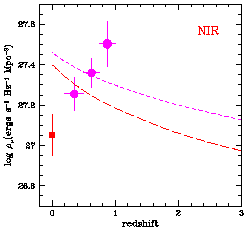
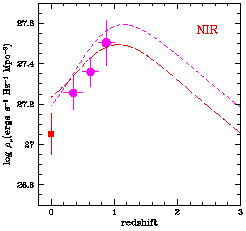
Figure 3. Left: Evolution of the
near-IR luminosity density
at rest-frame wavelengths of 1.0 µm (long-dashed
line) and 2.2 µm (short-dashed line). The data
points are taken from
[31]
(filled dots) and [16] (filled square).
The model assumes a constant star-formation rate of | |