

When coupled with distance estimates such as photometric redshifts, the study of morphology has the potential to probe the dynamical state and evolution of galaxies. However, morphological classification is only reliable to redshifts of a few tenths when hampered by ground-based seeing. The deep, high-resolution WFPC2 imaging of the Hubble Deep Field (HDF, Williams et al. 1996) dramatically pushed the study of galaxy morphology to faint magnitudes and high redshifts, revealing that by IAB > 24, the traditional Hubble sequence no longer provides an adequate description of most galaxies (Abraham et al. 1996).
Some of the faint peculiar galaxies are sub-luminous irregulars at
modest redshifts, while others are higher-z. But are they "true
peculiars" - the counterparts to local irregulars? Matters are
complicated by morphological k-corrections: for single
waveband selection, shorter rest wavelengths are sampled in higher-z
galaxies. The rest-UV is dominated by sites of recent star formation,
and it is known that the appearance of local Hubble-sequence galaxies
can be very different in the UV compared to the optical (e.g.,
O'Connell 1997).
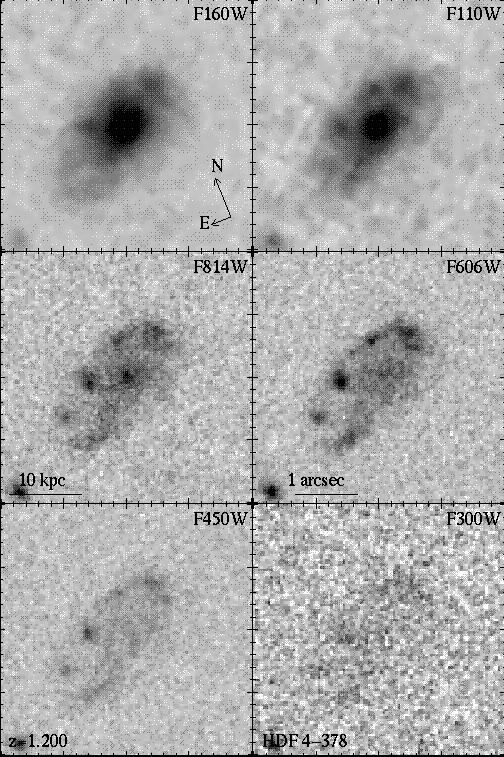
This change in apparent morphology, resulting from a dispersion of
stellar populations, is well illustrated by some HDF spirals at moderate
redshift (z  1)
which undergo a complete metamorphosis from the
observed optical to the near-IR (Fig. 1).
1)
which undergo a complete metamorphosis from the
observed optical to the near-IR (Fig. 1).

| 
|
Figure 1. Spiral galaxies at
z | |
|

|
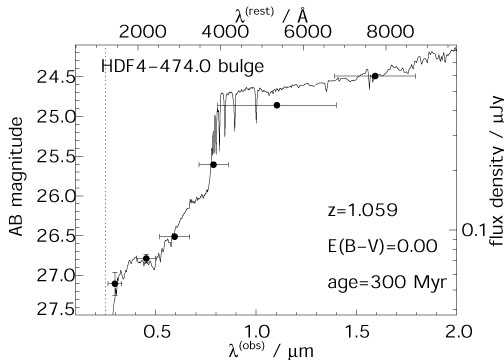
Figure 2. Stellar population fits
to two spatially resolved areas of the
z |
To address whether the apparent increased incidence of peculiars in the optical at faint magnitudes is attributable to genuine evolution in the fraction of irregular galaxies, or whether it is predominantly due to band-shifting effects, the appearance of galaxies over a variety of redshifts should be compared at the same rest wavelength (Fig. 3).

|
Figure 3. A montage of galaxies down to IAB < 26.0 which lie within the GTO-NICMOS Hubble Deep Field, ranked in order of redshift. Each galaxy is displayed in the waveband which most closely matches the rest-frame B-band, from the WFPC2 images (F450W-'B', F606W-'V', F814W-'I') and the NIC3 data (F110W-'J', F160W-'H'). Each box is 2arcsec across. At higher redshifts, the incidence of the familiar Hubble-sequence galaxies declines greatly. The identification numbers come from the catalog of Williams et al. (1996), and the photometric redshifts are taken from Fernández-Soto, Lanzetta & Yahil (1999). Those denoted by 'z(sp)' have spectroscopically-determined redshifts. |