


We have analyzed galaxy morphology to faint magnitudes in HDF-North
using the optical & near-IR HST images
(Bunker, Spinrad
& Thompson 1999).
We have studied the GTO-NICMOS data set
(Thompson et
al. 1999),
a 1arcmin2 area of the HDF imaged for 49 orbits with NIC3 in
both F110W
( J-band) and F160W
( H-band). Combined
with the four WFPC2 pass-bands
(Fig. 3), this data set
provides deep, multi-color, high-resolution imaging extending out to
1.6 µm - the rest-optical at z ~ 2. We use the
redshifts of the galaxies to match the rest-wavelengths, determine intrinsic
luminosities, and to fit stellar populations/dust reddening to the
spectral energy distributions. Where available, we use the
spectroscopically-measured redshifts (from Cohen et al. 1996 unless
otherwise noted). Where no published spectroscopic redshift exists, we
adopt the photometric redshift estimate of
Fernández-Soto,
Lanzetta & Yahil (1999).
J-band) and F160W
( H-band). Combined
with the four WFPC2 pass-bands
(Fig. 3), this data set
provides deep, multi-color, high-resolution imaging extending out to
1.6 µm - the rest-optical at z ~ 2. We use the
redshifts of the galaxies to match the rest-wavelengths, determine intrinsic
luminosities, and to fit stellar populations/dust reddening to the
spectral energy distributions. Where available, we use the
spectroscopically-measured redshifts (from Cohen et al. 1996 unless
otherwise noted). Where no published spectroscopic redshift exists, we
adopt the photometric redshift estimate of
Fernández-Soto,
Lanzetta & Yahil (1999).
Comparative Morphology: Down to
IAB 26
(the brightest 100 galaxies in GTO-NICMOS field):
only about 1/6 of galaxies change their appearance
greatly between the WFPC2 and NICMOS images - these have large
morphological k-corrections;
about half of the galaxies retain the same
morphology in all
wavebands (above the redshifted Lyman break) and are "true irregulars";
the remaining third of galaxies are too compact
for changes in
morphology to be ascertained (the NIC3 PSF has a FWHM of
0.25arcsec); for most
cosmologies, the higher-redshift systems are on average more compact.
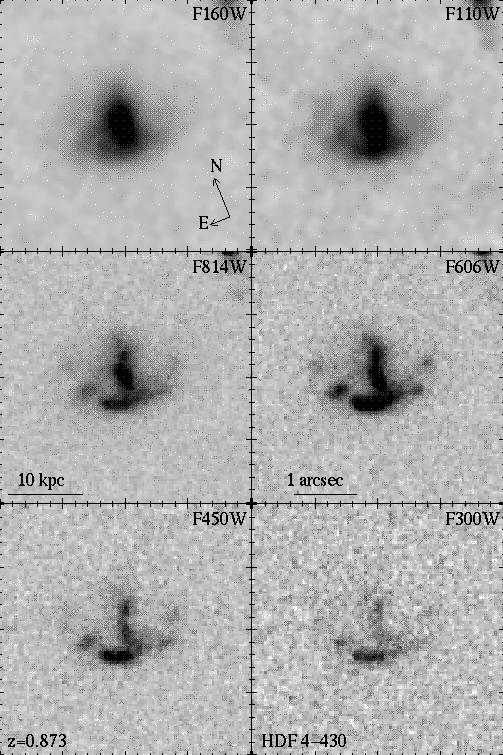
Spatially-Resolved Stellar Populations: Once we correct for different resolutions of NIC3 and WFPC2 (through "PSF matching"), we can use the spatially-resolved colors to study different stellar populations and/or dust-reddening within a galaxy (see Figs. 2 & 5). Some of the galaxies which have the same appearance at all wavelengths fall outside the traditional Hubble tuning-fork diagram, but instead belong to new morphological groups, such as chain galaxies (Fig. 4; Cowie, Hu & Songaila 1995), tadpoles (van den Bergh et al. 1996) and bow-shock systems (Fig. 4).
| 
|
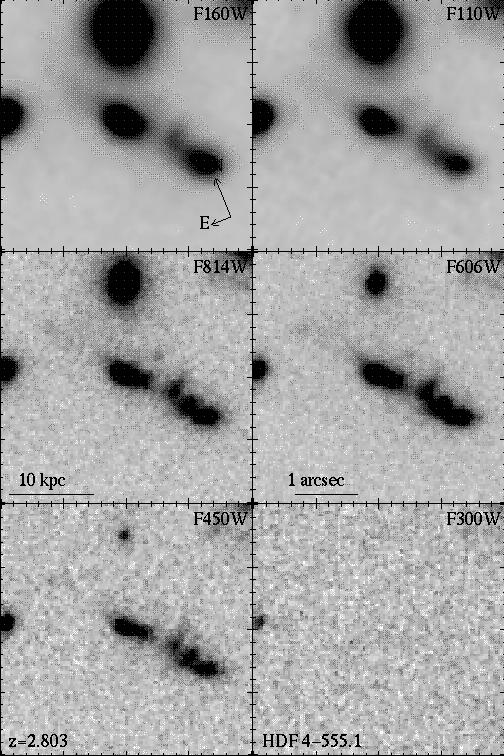
Figure 4. Examples of a bow-shock interacting system (left) and a chain galaxy (right). Note the bow-shock area itself is comparatively blue, implying a young stellar population with star formation presumably triggered by the shock front, whereas the redder (older) core of the galaxy is more prominent in the near-IR. The chain galaxy (the two-component U-drop called "the Hot Dog"; Steidel et al. 1996, Bunker et al. 1998) appears the same at all wavelengths and is blue, implying a relatively homogeneous, young population (a primæval galaxy candidate?). | |
|

|
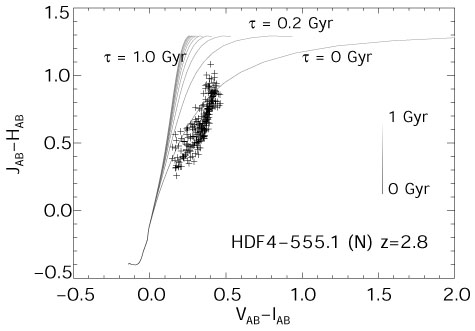
Figure 5. Spatially-resolved colors of the northern and southern components of the chain galaxy called "the Hot Dog" (HDF4-555.1; Fig. 4). The northern and southern components exhibit subtly different colors, attributable to either different stellar populations or non-uniform dust extinction. Adopting the approach of Abraham (1997), we also plot the evolution in the (V - I) and (J - H) colors with time for a Salpeter IMF and an exponentially-decaying star formation rate, with e-folding times ranging from 0.1Gyr to 1Gyr. At z = 2.8, (J - H) straddles the age-sensitive 4000Å break. |
Barred Spirals: Our data can also address the evolution of galactic bars: it has been claimed that at faint magnitudes, the fraction of barred spirals in the optical HDFs declines rapidly (van den Bergh et al. 1996, Abraham et al. 1999). If this is a truly evolutionary effect, then it has great significance for the physics of disk formation: bars are supported by disk self-gravity, so the implication would be either that at high-z the halo mass dominates that of the disk, or there are significant random motions in the stellar orbits (Ostriker & Peebles 1973).
However, when the spirals are imaged in the near-IR, many are revealed to have bars which are absent in the WFPC2 bands (Fig. 6): the bars have similar colors to the bulges (dominated by older, cooler, redder stars). It appears that morphological k-correction effects for the higher-z spirals cause the apparent decline in optically-selected barred spirals at fainter magnitudes. From the small-number statistics of spirals in the GTO-NICMOS field, there is no significant evolution in the incidence of galactic bars.

| 
|
Figure 6. The left panel
shows the only optically-selected barred spiral in HDF-North
(van den Bergh et
al. 1996),
and this seems to be through chance alignment of a swath of young stars
with the approximate axis of the true bar. The
galactic bar in the spiral displayed in the right panel is only
recognizable at infrared-wavelengths - at its redshift of
z | |